Join us for a webinar: The complexities of spatial multiomics unraveled
May 2

PGS Documentation

Page tree

Versions Compared

Key

  • This line was added.
  • This line was removed.
  • Formatting was changed.

...


Numbered figure captions
SubtitleText
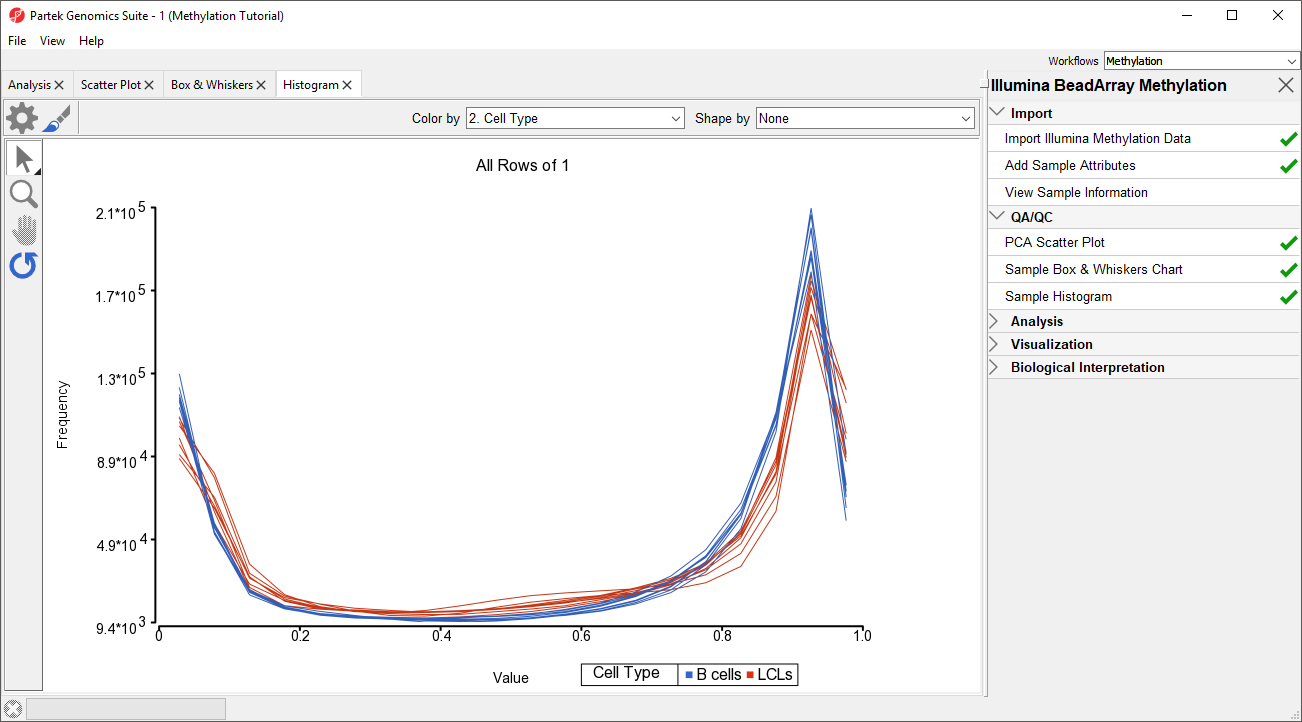
Sample histogram. Each sample is a line, M-beta values are on the horizontal axis and their frequencies on the vertical axis. Two peaks correspond to two probe types (I and II) present on the MethylationEPIC array. Sample colors correspond to a categorical attribute (Cell Type)
AnchorNamesample histogram


...