Page History
...
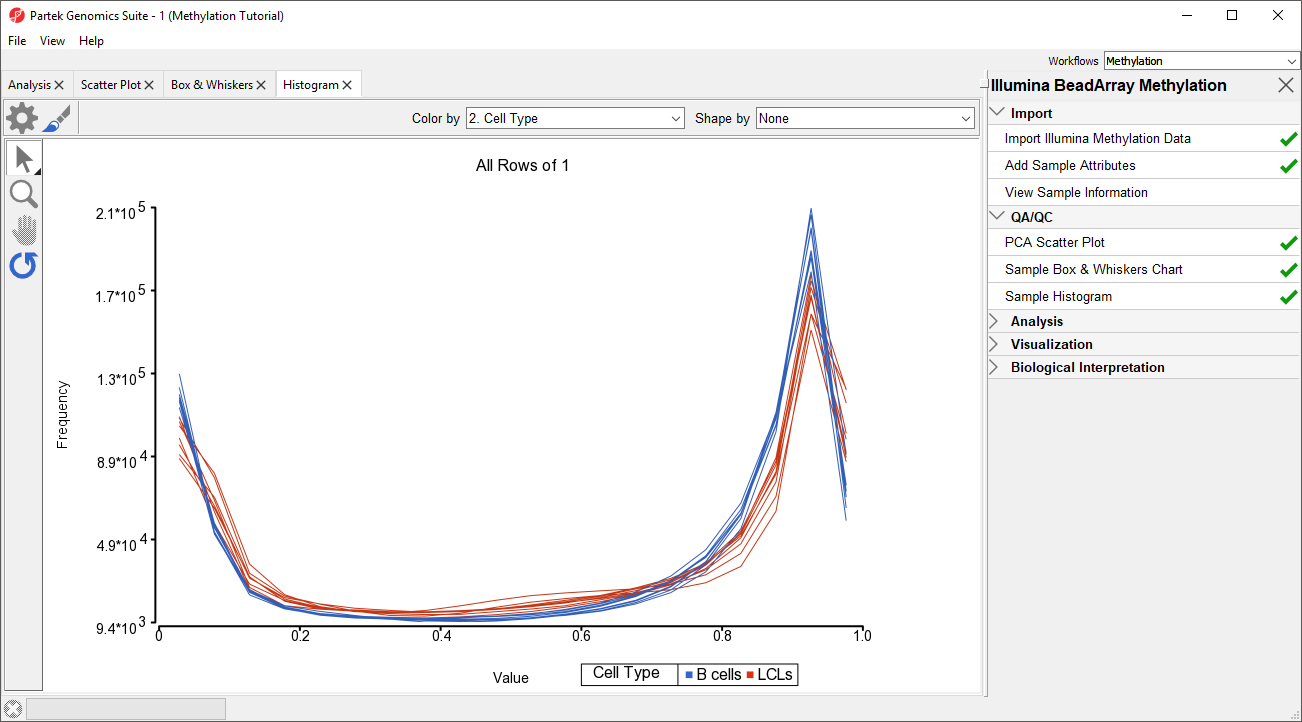
An alternative way to take a look at the distribution of beta-values is a histogram.
- Select Plot Sample Histogram from the QA/QC section of the Illumina BeadArray Methylation workflow to bring up a Histogram tab
...
| Numbered figure captions | ||||
|---|---|---|---|---|
| ||||
|
...
Overview
Content Tools