Page History
...
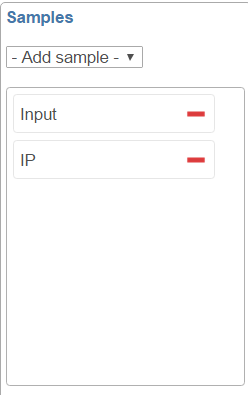
By default, all the samples are selected to display, to remove a sample track, click on the  button next to the sample name on the sample control panel (Figure ); to add a sample in the plot, select the sample name from the Add sample drop-down list, a new line will be added on the plot.
| Numbered figure captions | ||||
|---|---|---|---|---|
| ||||
|
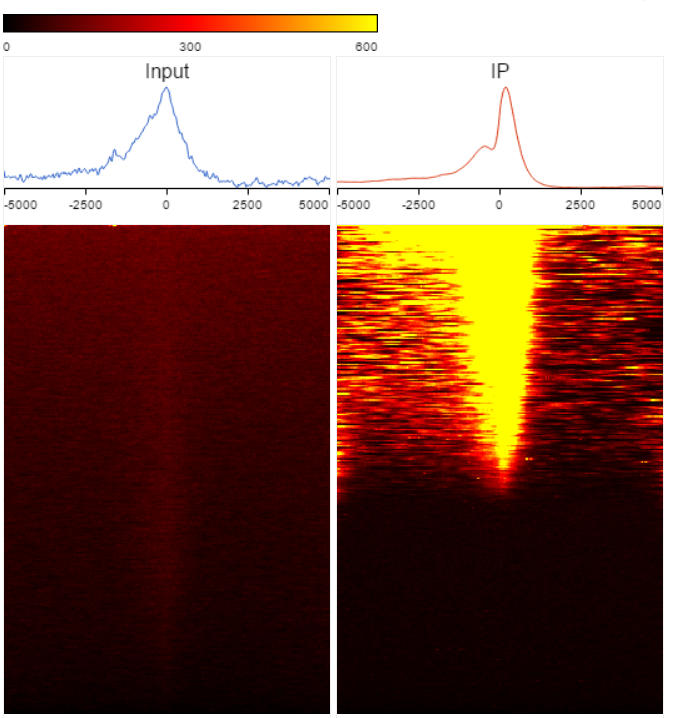
TSS heatmap
Heatmap is another way to view the coverage of gene body overlapped with the peaks (Figure ). The X-axis represents the same profile plot, actually each samples profile plot is display again on the top of the heatmap. In the heatmap, each row represents a gene, color represents the read coverage, genes are sorted based on total read counts in descending order from the top to the bottom.
| Numbered figure captions | ||||
|---|---|---|---|---|
| ||||
|
| Numbered figure captions | ||||
|---|---|---|---|---|
| ||||
|
...
Overview
Content Tools