Page History
...
Space Ranger is a set of analysis pipelines that process Visium Spatial Gene Expression data with brightfield and fluorescence microscope images (1).
Space Ranger in Partek
...
Flow
Space Ranger 12.30.0 1 has been wrapped in Partek Flow as Space Ranger task. The task takes .fastq and .jpeg/.tiff files as input and performs alignment, filtering, barcode counting, and UMI counting. The output is gene expression count matrix in a .h5 format (both raw and filtered are available for download via Task Details), as well as a .zip file with spatial files (image). Note that the Space Ranger task in Partek Flow does not include all the options and uses cases covered by the Space Ranger pipelines of 10x Genomics.
...
If necessary, click on the Configure link in the Advanced options section to open the Advanced Options dialog (Figure 54). Use R1 length to hard trim the R1 reads to specified length; use R2 length to hard trim the R2 reads to specified length.
...
The result of Space Ranger task is the Single cell counts data node, which contains the gene expression data. Double click the Single cell counts node to invoke the task report (Figure 65) which is the same as the ‘Summary HTML’ from the original 10x Genomic pipelines. Task report is sample based. You can use the dropdown list in top left to switch samples (not shown in Figure 6). Each report consists of two pages: Summary and Analysis. For details, please visit 10x Genomics web page.
...
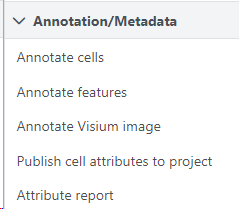
After creating the Single cell counts node, the next step is to associate the microscopy image with the expression data. To start, select the Single cell counts data node and then go to Annotate Visium image in the toolbox (Figure 76).
| Numbered figure captions | ||||
|---|---|---|---|---|
| ||||
|
...
The setup page shows the sample table (one sample per row; Figure 87). Click on the Browse button to open the file browser and point to the file <project-name>_spatial.zip, created by the Space Ranger task. After that, click on Finish to launch the Annotate task.
...
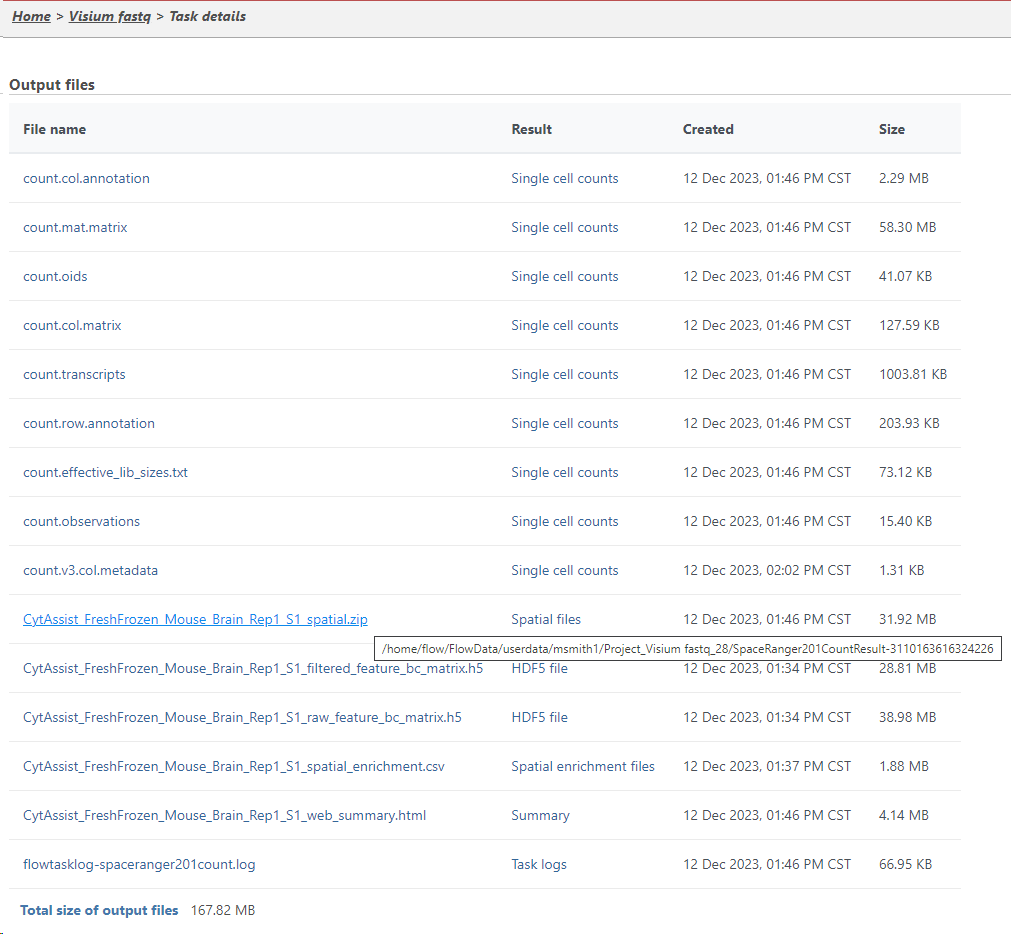
You can find the location of the <project-name>_spatial.zip file using the following steps. Select the Space Ranger task node (i.e. the rectangle) and then click on the Task Details (toolbox). Click on the Output files link to open the page with the list of files created by the Space Ranger task. Mouse over any of the files to see the directory in which the file is located. Figure 9 8 shows the path to the .zip file which is required for Annotate Visium image.
| Numbered figure captions | ||||
|---|---|---|---|---|
| ||||
|
A new data node, Annotated counts, will be generated (Figure 9).
| Numbered figure captions | ||||
|---|---|---|---|---|
| ||||
|
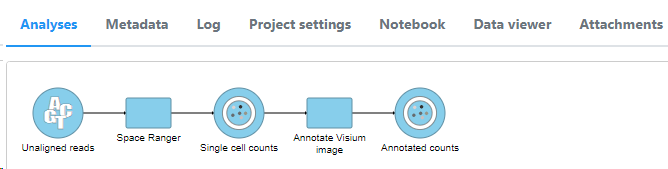
The Annotated counts node is Split by sample. This means that any tasks performed from this node will also be split by sample. Invoke tasks from the Single cell counts node to combine samples for analyses.
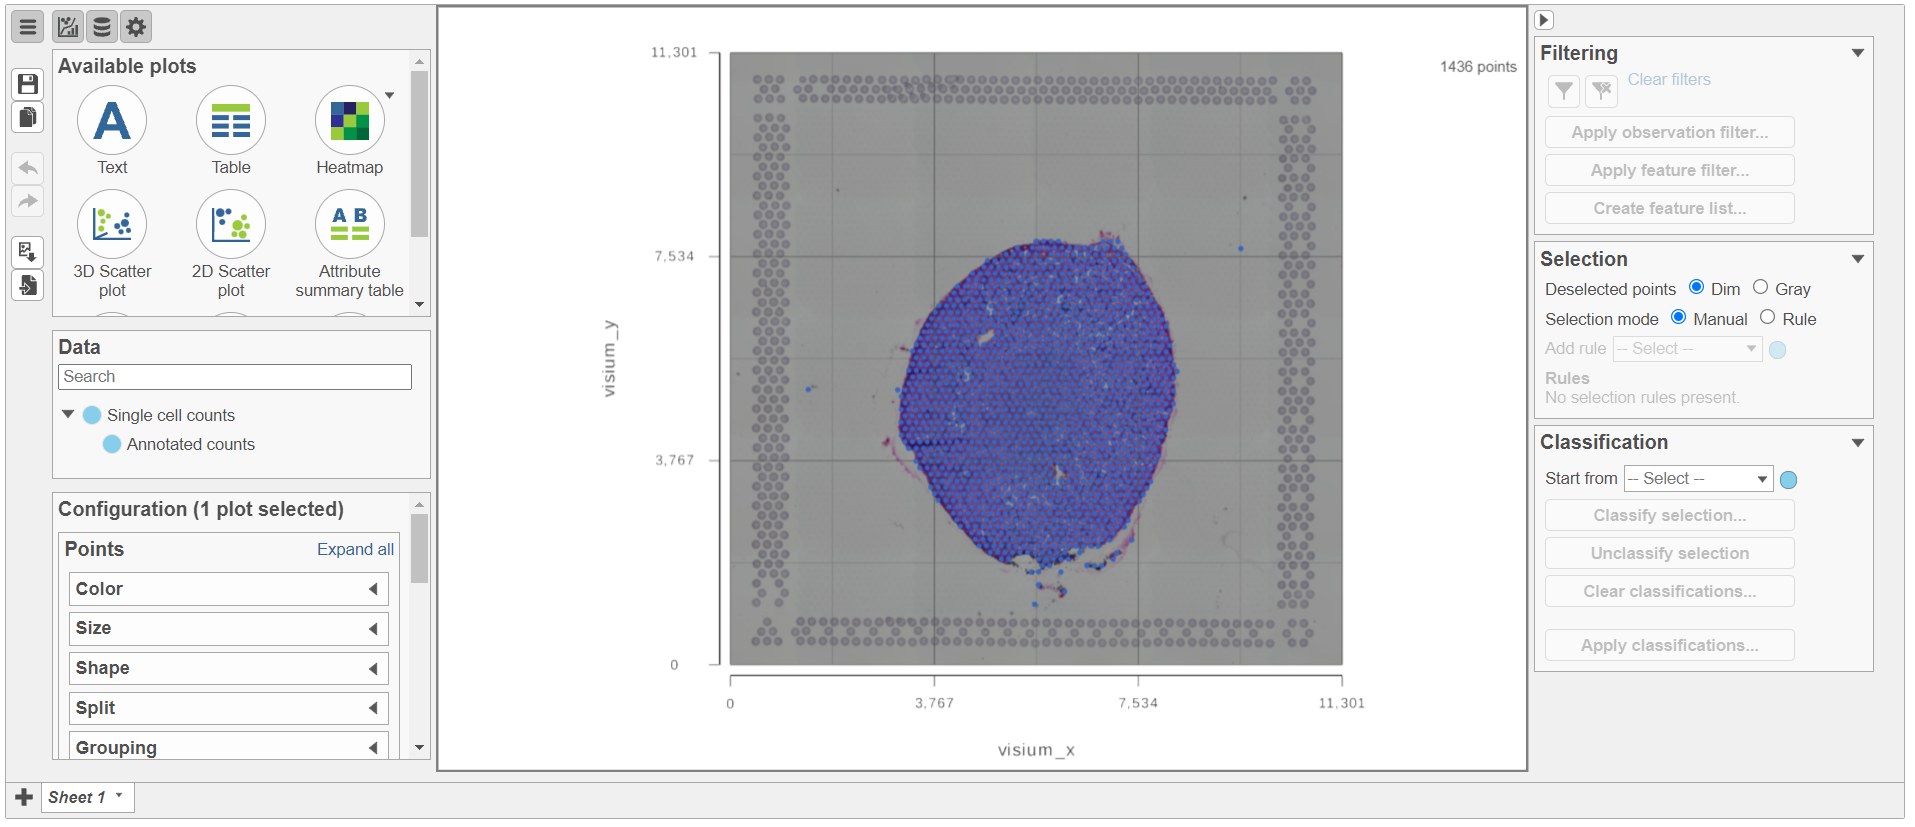
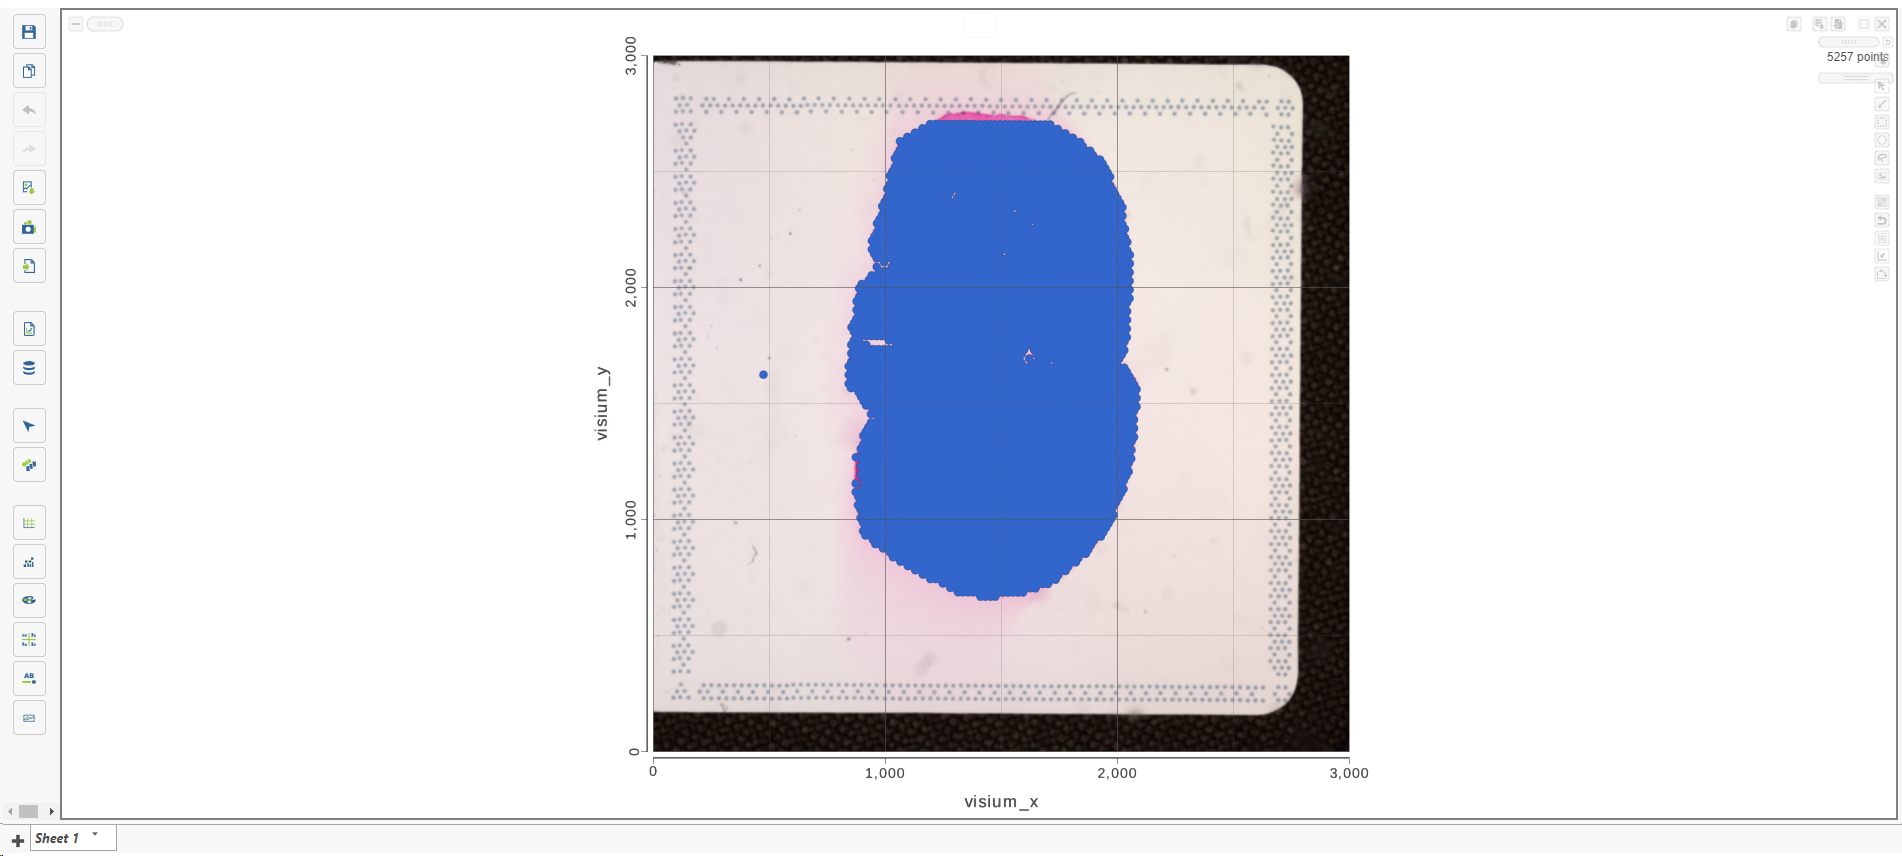
Annotate Visium image task creates a new node, Annotated counts. Double click on the Annotated counts node to invoke the Data Viewer showing data points overlaid on top of the microscopy image (Figure 10).
| Numbered figure captions | ||||
|---|---|---|---|---|
| ||||
|
Resources
...
Overview
Content Tools