Page History
...
- Select Differential Expression Analysis from the Analyze Known Genes section of the RNA-Seq workflowThe
The Differential Expression Analysis dialog offers the choice of analyzing at Gene-,Transcript-, or Exon-level.
- Select Gene-level
- Specify the 1/gene_rpkm (RNA-Seq_results.gene.rpkm) spreadsheet from the Spreadsheet drop-down menu (Figure 1)
...
| Numbered figure captions | ||||
|---|---|---|---|---|
| ||||
|

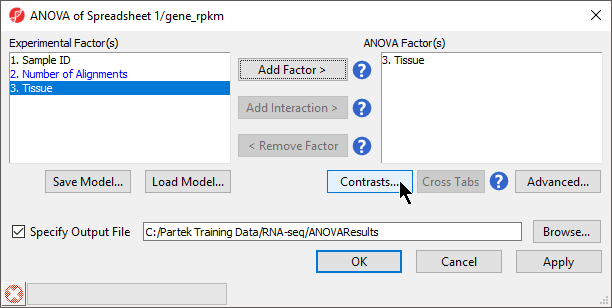
If the ANOVA were now performed (without contrasts), a p-value for differential expression would be calculated, but it would only indicate if there are differences within the factor Tissue; it would not inform you which groups are different or give any information on the magnitude of the change difference between groups (fold-change or ratio). To get this more specific information, you need to define linear contrasts.
- Select Contrasts... to open the Configure dialog
- For Select Factor/Interaction, Tissue will be the only factor available as it was the only factor included in the ANOVA model in the previous step; if multiple factors were included, they could be selected in the Select Factor/Interaction: drop-down menu. The levels in this factor are listed on the Candidate Level(s) panel on the left side of the dialog
- For this data set, verify that No is selected for Data is already log transformed?
- Left click to select muscle from muscle from the Candidate Level(s) panel and move it to the Group 1 panel (renamed muscle) by selecting Add Contrast Level > in the top half of the dialog. Label 1 will be changed to the subgroup name automatically, but you can also manually specify the label name
- Select not muscle from the Candidate Level(s) panel and move it to the Group 2 panel (renamed not muscle)
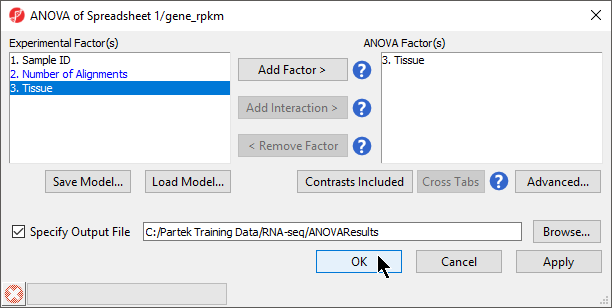
- The Add Contrast button can now be selected (Figure 3)
- Select OK to return to the ANOVA dialog
...
| Numbered figure captions | ||||
|---|---|---|---|---|
| ||||
|

...
| Numbered figure captions | ||||
|---|---|---|---|---|
| ||||
|

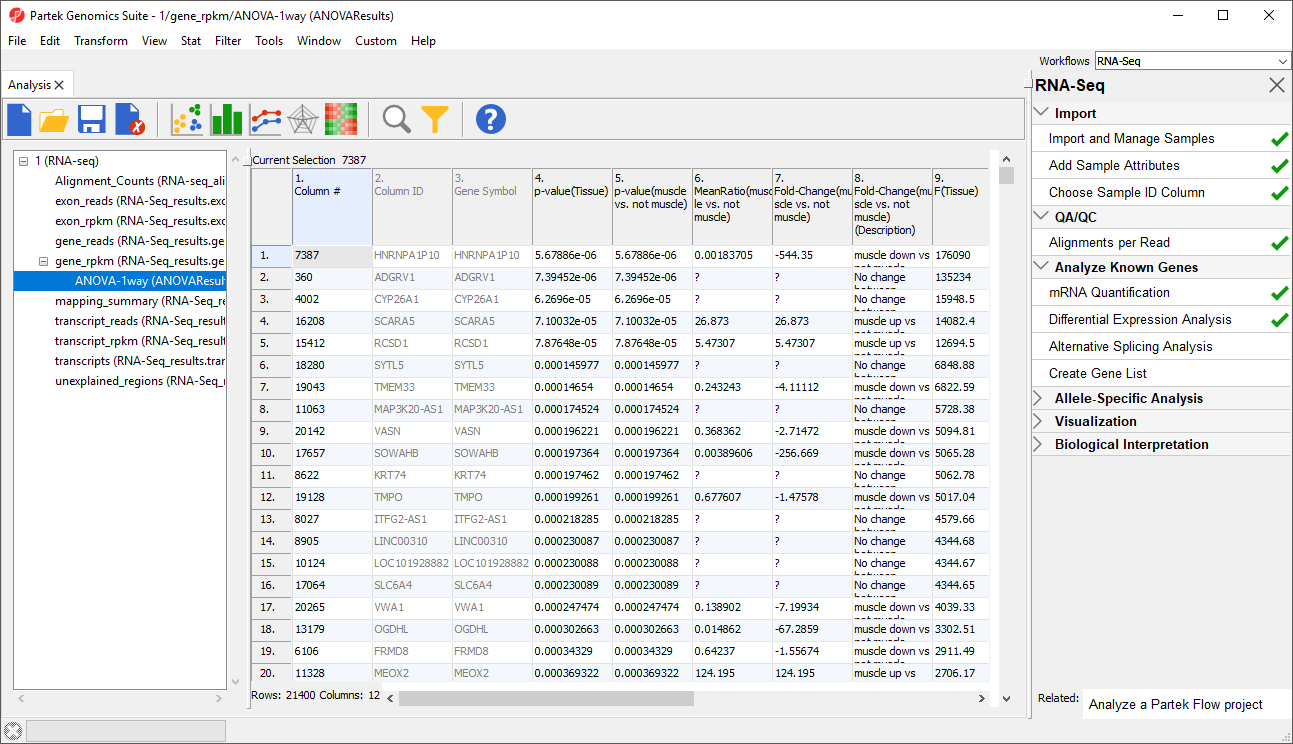
In this tutorial, the overall p-value for the factor (column 4) is the same as the p-value for the linear contrast (column 5) as there are only two levels within Tissue. If we had more than two groups, the overall p-value and the linear contrast p-values would most likely differ. You can also see the ? symbol in the ratio/fold-change columns (6 and 7) for several genes that also have a low p-value because there are zero reads in one of the groups, thus making it impossible to calculate ratios and fold-changes between groups.
For a more detailed example of ANOVA set upusing ANOVA with more complicated experimental designs, including multiple factors and linear contrasts, please refer to Identifying Differentially Expressed Genes differentially expressed genes using ANOVA in the Gene Expression Analysis tutorial.
...
Overview
Content Tools