Page History
| Table of Contents | ||||||
|---|---|---|---|---|---|---|
|
Overview of Trajectory Analysis
Cells undergo changes to transition from one state to another as part of development, disease, and throughout life. Since those changes can be gradual, trajectory analysis attempts to describe progress through a biological process as a position along a path. Because biological processes are often complex, trajectory analysis builds branching trajectories where different paths can be chosen at different points along the trajectory. The progress of a cell along a trajectory from the starting point or root, can be quantified as a numeric value, pseudotime.
In Partek Flow, we use tools from Monocle 3 (1) to build trajectories, identify states and branch points, and calculate pseudotime values. The output of Trajectory analysis task includes an interactive 2D/3D visualization for viewing the trajectory trees and setting the root states (starting points of the trajectories). From the Trajectory analysis report, you can run a second task, Calculate pseudotime, which adds a numeric cell-level attribute, Pseudotime, calculated using the chosen root states.
...
| Numbered figure captions | ||||
|---|---|---|---|---|
| ||||
|
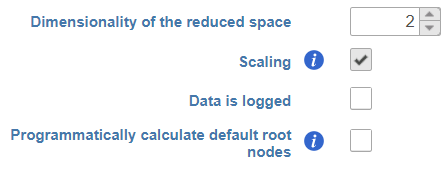
Under the hood, Monocle 3 will perform log2 transformation of the gene count matrix (if Data is logged was unselected), scale the matrix (if Scaling was selected), and project the gene count matrix into the top 50 principal components. Next, the dimensionality reduction will be implemented by UMAP (using default settings of the reduce _ dimension command command).
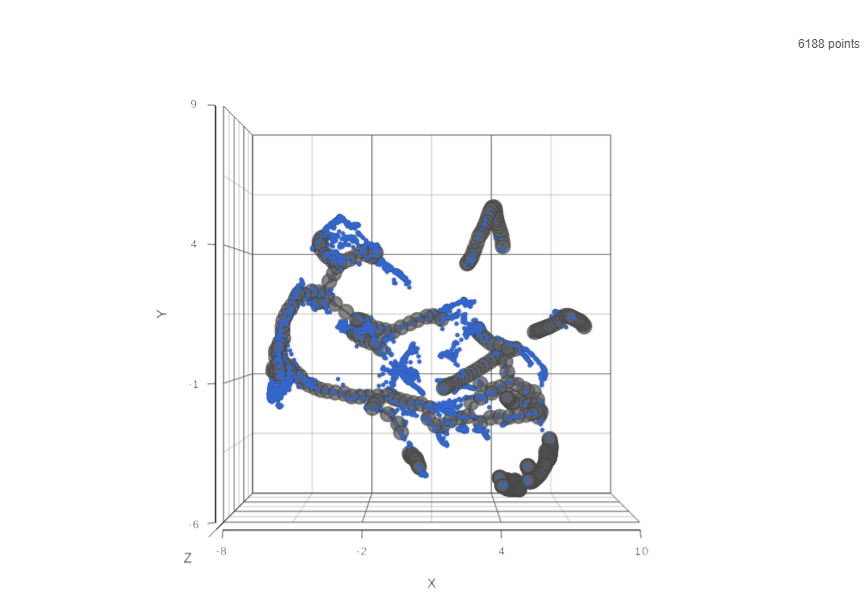
Trajectory Analysis Result
...
| Numbered figure captions | ||||
|---|---|---|---|---|
| ||||
|
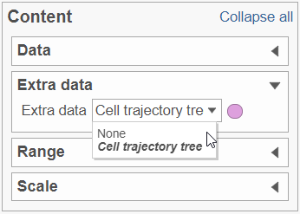
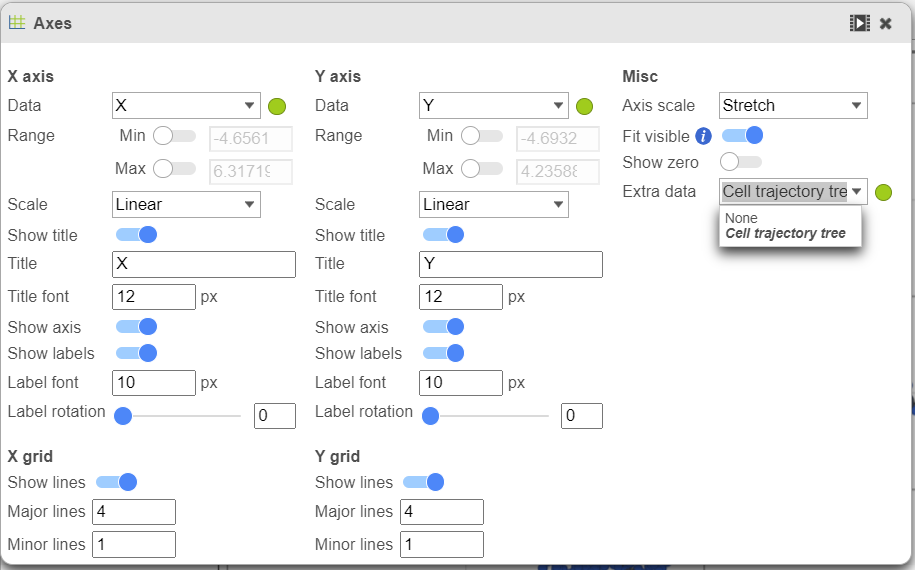
To show / hide cell trajectory tree and trajectory nodes, use the Extra data option on the Content card select Axes in Configure section and on the upper-right corner of the dialog, select the Extra data drop-down options (Figure 2).
| Numbered figure captions | ||||
|---|---|---|---|---|
| ||||
|
Pseudotime Analysis
...
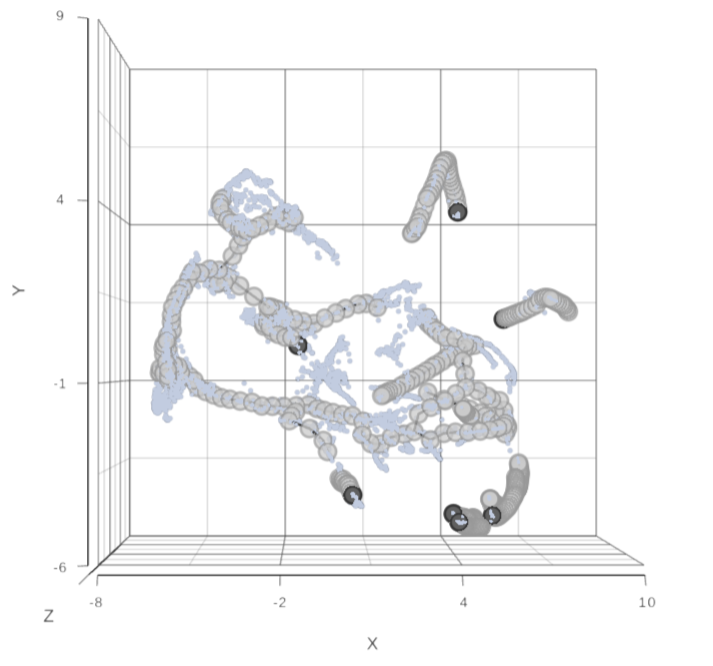
To start, select the root cell nodes (gray circles in trajectory tree) by left-clicking. If the trajectory result consists of more than one trajectory tree, you can specify more than one root node, e.g. one root node per trajectory tree (ctrl & click). If no root node is specified for a tree, that tree will not be included in the pseudotime calculation. Figure 4 shows an example where seven root nodes were identified.
...
| Numbered figure captions | ||||
|---|---|---|---|---|
| ||||
|
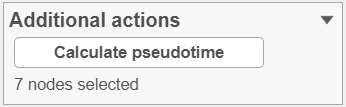
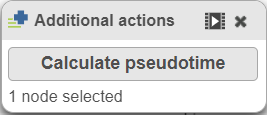
Once you have identified all the root nodes, click on Additional button in Tools section on the left panel, push the Calculate pseudotime button in the Selection panel dialog (Figure 5).
| Numbered figure captions | ||||
|---|---|---|---|---|
| ||||
|
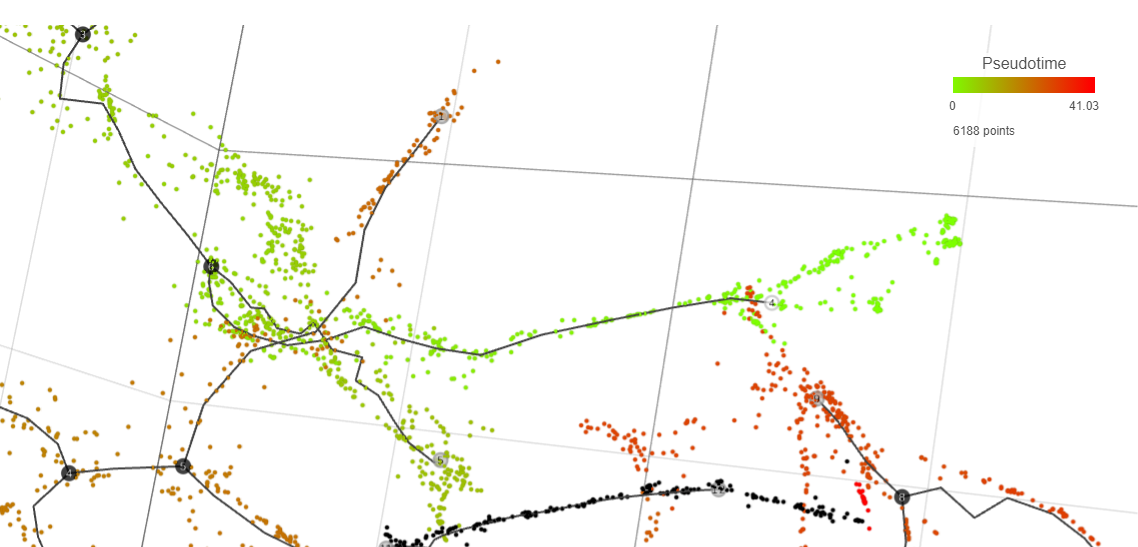
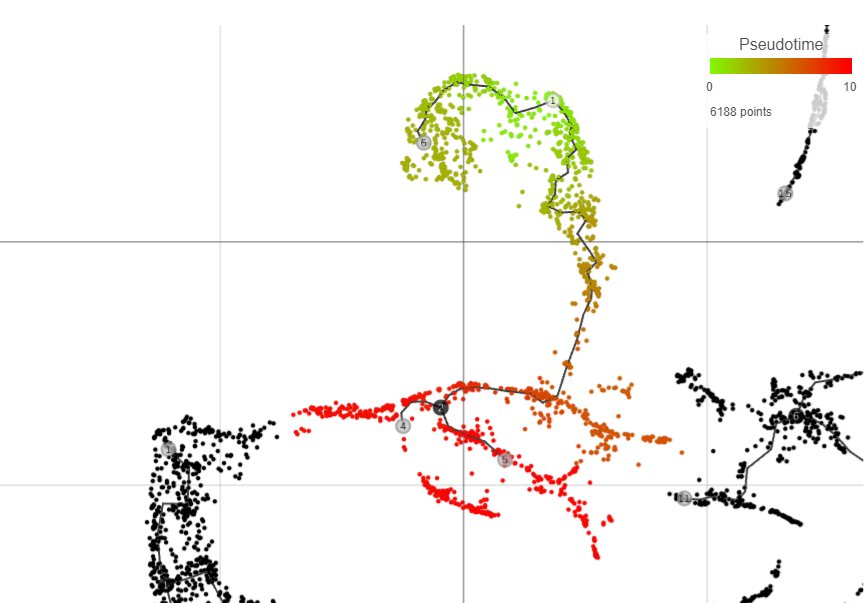
As a result, the cells will be annotated by pseudotime, using green to red gradient (start and end, respectively) (Figure 6). If, for a particular tree, no root node has been identified, those cells will be omitted from the pseudotime calculation and will be colored in black (Figure 9).
...
| Numbered figure captions | ||||
|---|---|---|---|---|
| ||||
|
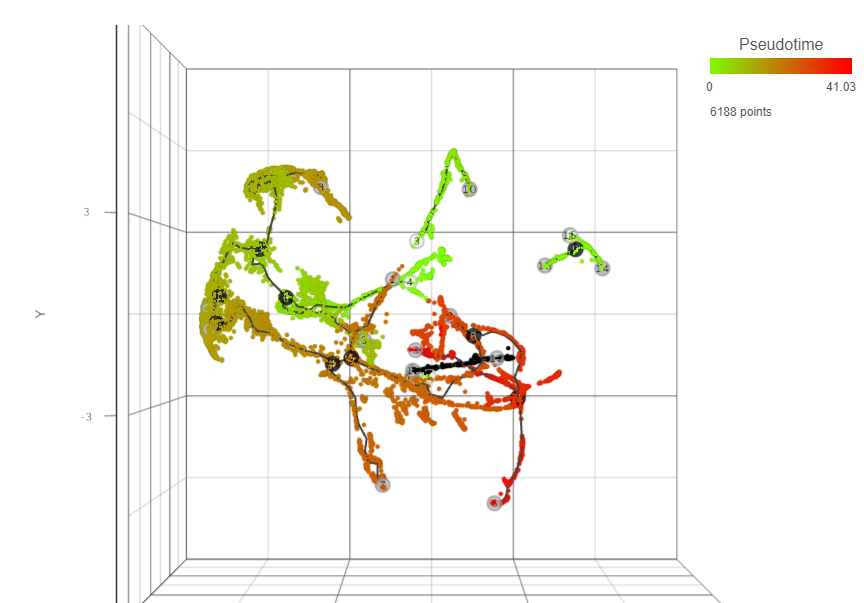
Following pseudotime calculation, three types of cell nodes will be annotated on the plot.Pseudotime calculation display the structure of the graph using black lines. The circles with numbers (cell nodes) on the black lines represent special points. There are three types of cell nodes:
- Root node (white). Root nodes are start points of the pseudotime and were defined by the user in the previous step (e.g. node 4 in Figure 7).
- Branch node (black). Branch nodes indicate where the trajectory tree forks out; i.e. each branch represents a different cell fate or different trajectory (e.g. nodes 3-6, and 8 in Figure 7).
- Leaf (light gray). Leaves correspond to different cell fates / different trajectory outcomes (e.g. nodes 5, 9, and 12 in Figure 7). The leaves correspond to cell states of Monocle 2.
The numbers within the circles are provided for reference purposes only. The intermediate nodes from the previous step have been removed.
...
| Numbered figure captions | ||||
|---|---|---|---|---|
| ||||
|
Automatic Selection of the Root Node
...
| Numbered figure captions | ||||
|---|---|---|---|---|
| ||||
|
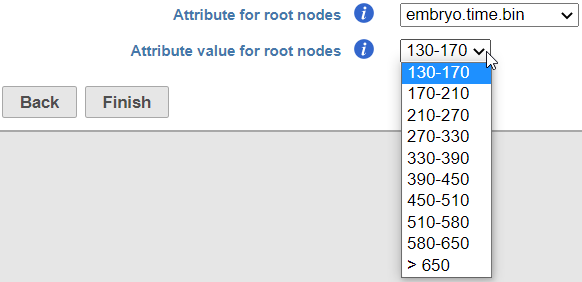
Once the options have been set, Monocle 3 will first group the cells according to which trajectory node they are nearest to. It then calculates the fraction of the cells from the earliest time point at each trajectory node. Finally, it picks the node with the highest prevalence of the early cells and treats it as the root node.
...
| Numbered figure captions | ||||
|---|---|---|---|---|
| ||||
|
Difference Between Monocle 3 and Monocle 2
Major updates in Monocle 3 (compared to Monocle 2) include:
- Monocle 3 learns the principal trajectory graph in the UMAP space;
- the principal graph is smoothened and small branches are excluded;
- support for principal graphs with loops and convergence points;
- support for multiple root nodes.
References
- Cao J, Spielmann M, Qiu X, Huang X, Ibrahim DM, Hill AJ, Zhang F, Mundlos S, Christiansen L, Steemers FJ, Trapnell C, Shendure J. The single-cell transcriptional landscape of mammalian organogenesis. Nature. 2019 Feb;566(7745):496-502. doi: 10.1038/s41586-019-0969-x. Epub 2019 Feb 20. PMID: 30787437; PMCID: PMC6434952.
...
Overview
Content Tools