Page History
A Pie Chart is a type of graph that displays data in a circular graph. It gives you a snapshot of how a group is broken down into smaller pieces. Because the pieces of a Pie chart are proportional to the fraction of the whole in each category. In order to make a Pie chart, you must have a list of categorical variables (descriptions of your categories, like ‘cell type’) as well as numeric variables (e.g., cell numbers). In Partek® Flow®, the default numeric variable is the cell numbers. Therefore, the Pie chart indicates the fraction of the whole cell numbers in each category.
...
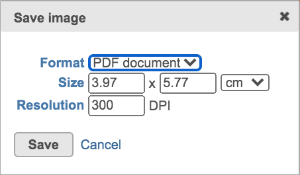
Once you are pleased with the appearance of the Pie plot, push Save Export image button to save it to the local machine or click Save button to save the Data Viewer. The resulting dialog (Figure 8) controls the Format, Size and Resolution of the image file. The image will be saved in your favorite format (.svg, .png and .pdf).
| Numbered figure captions | ||||
|---|---|---|---|---|
| ||||
|
...
Overview
Content Tools