Page History
...
STARsolo is a versatile tool developed for single-cell RNA sequencing analysis. It inputs the raw FASTQ reads files, and performs mapping, demultiplexing and quantification for single cell RNA-seq data. It follows CellRanger logic for cell barcode whitelisting and UMI deduplication, and produces nearly identical gene counts in the same format. STARsolo is also running much faster than the CellRanger[1].
Run STARsolo in Partek Flow
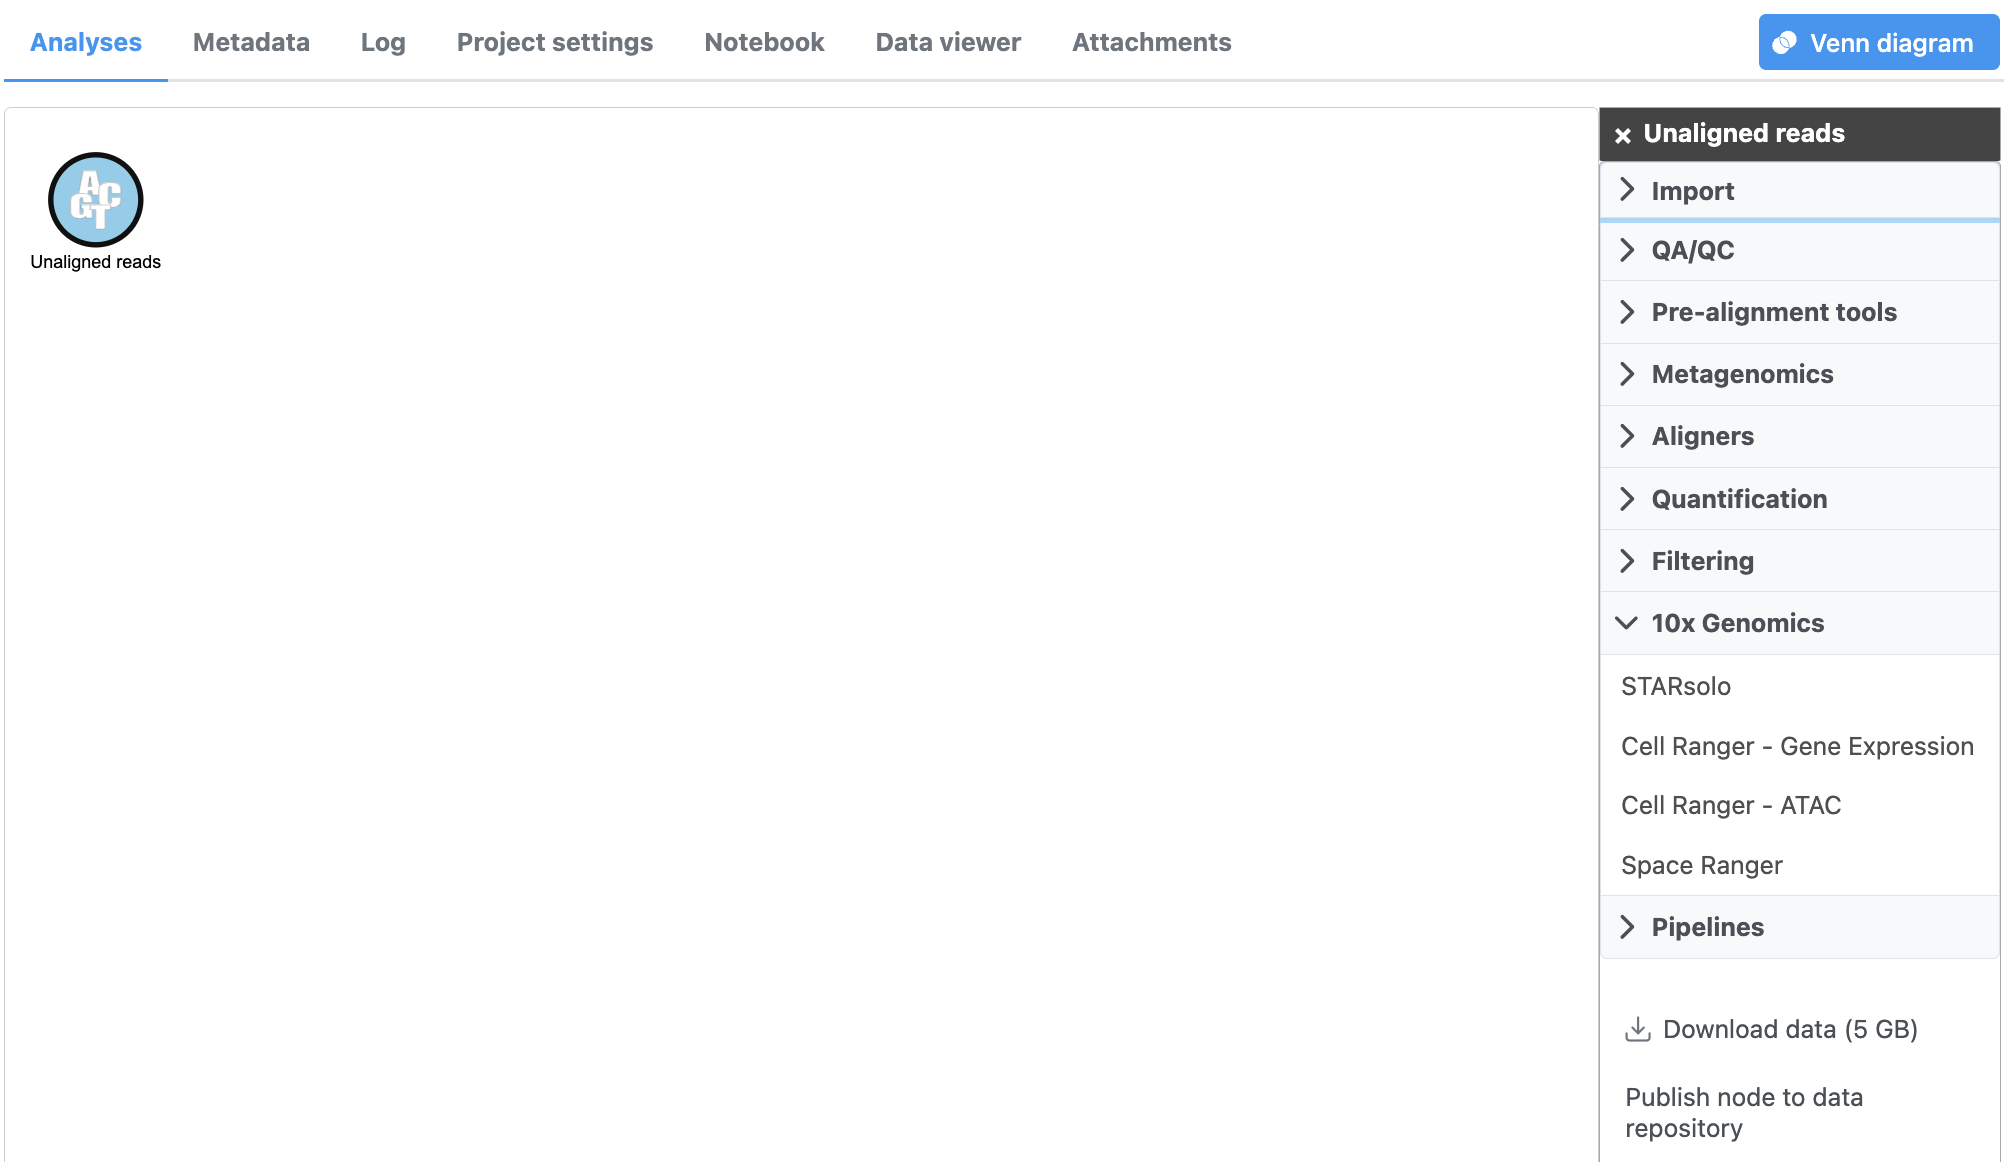
Partek® Flow® wraps STARsolo v2.7.11a and focuses on assays from 10X Genomics.
...
| Numbered figure captions | ||||
|---|---|---|---|---|
| ||||
|
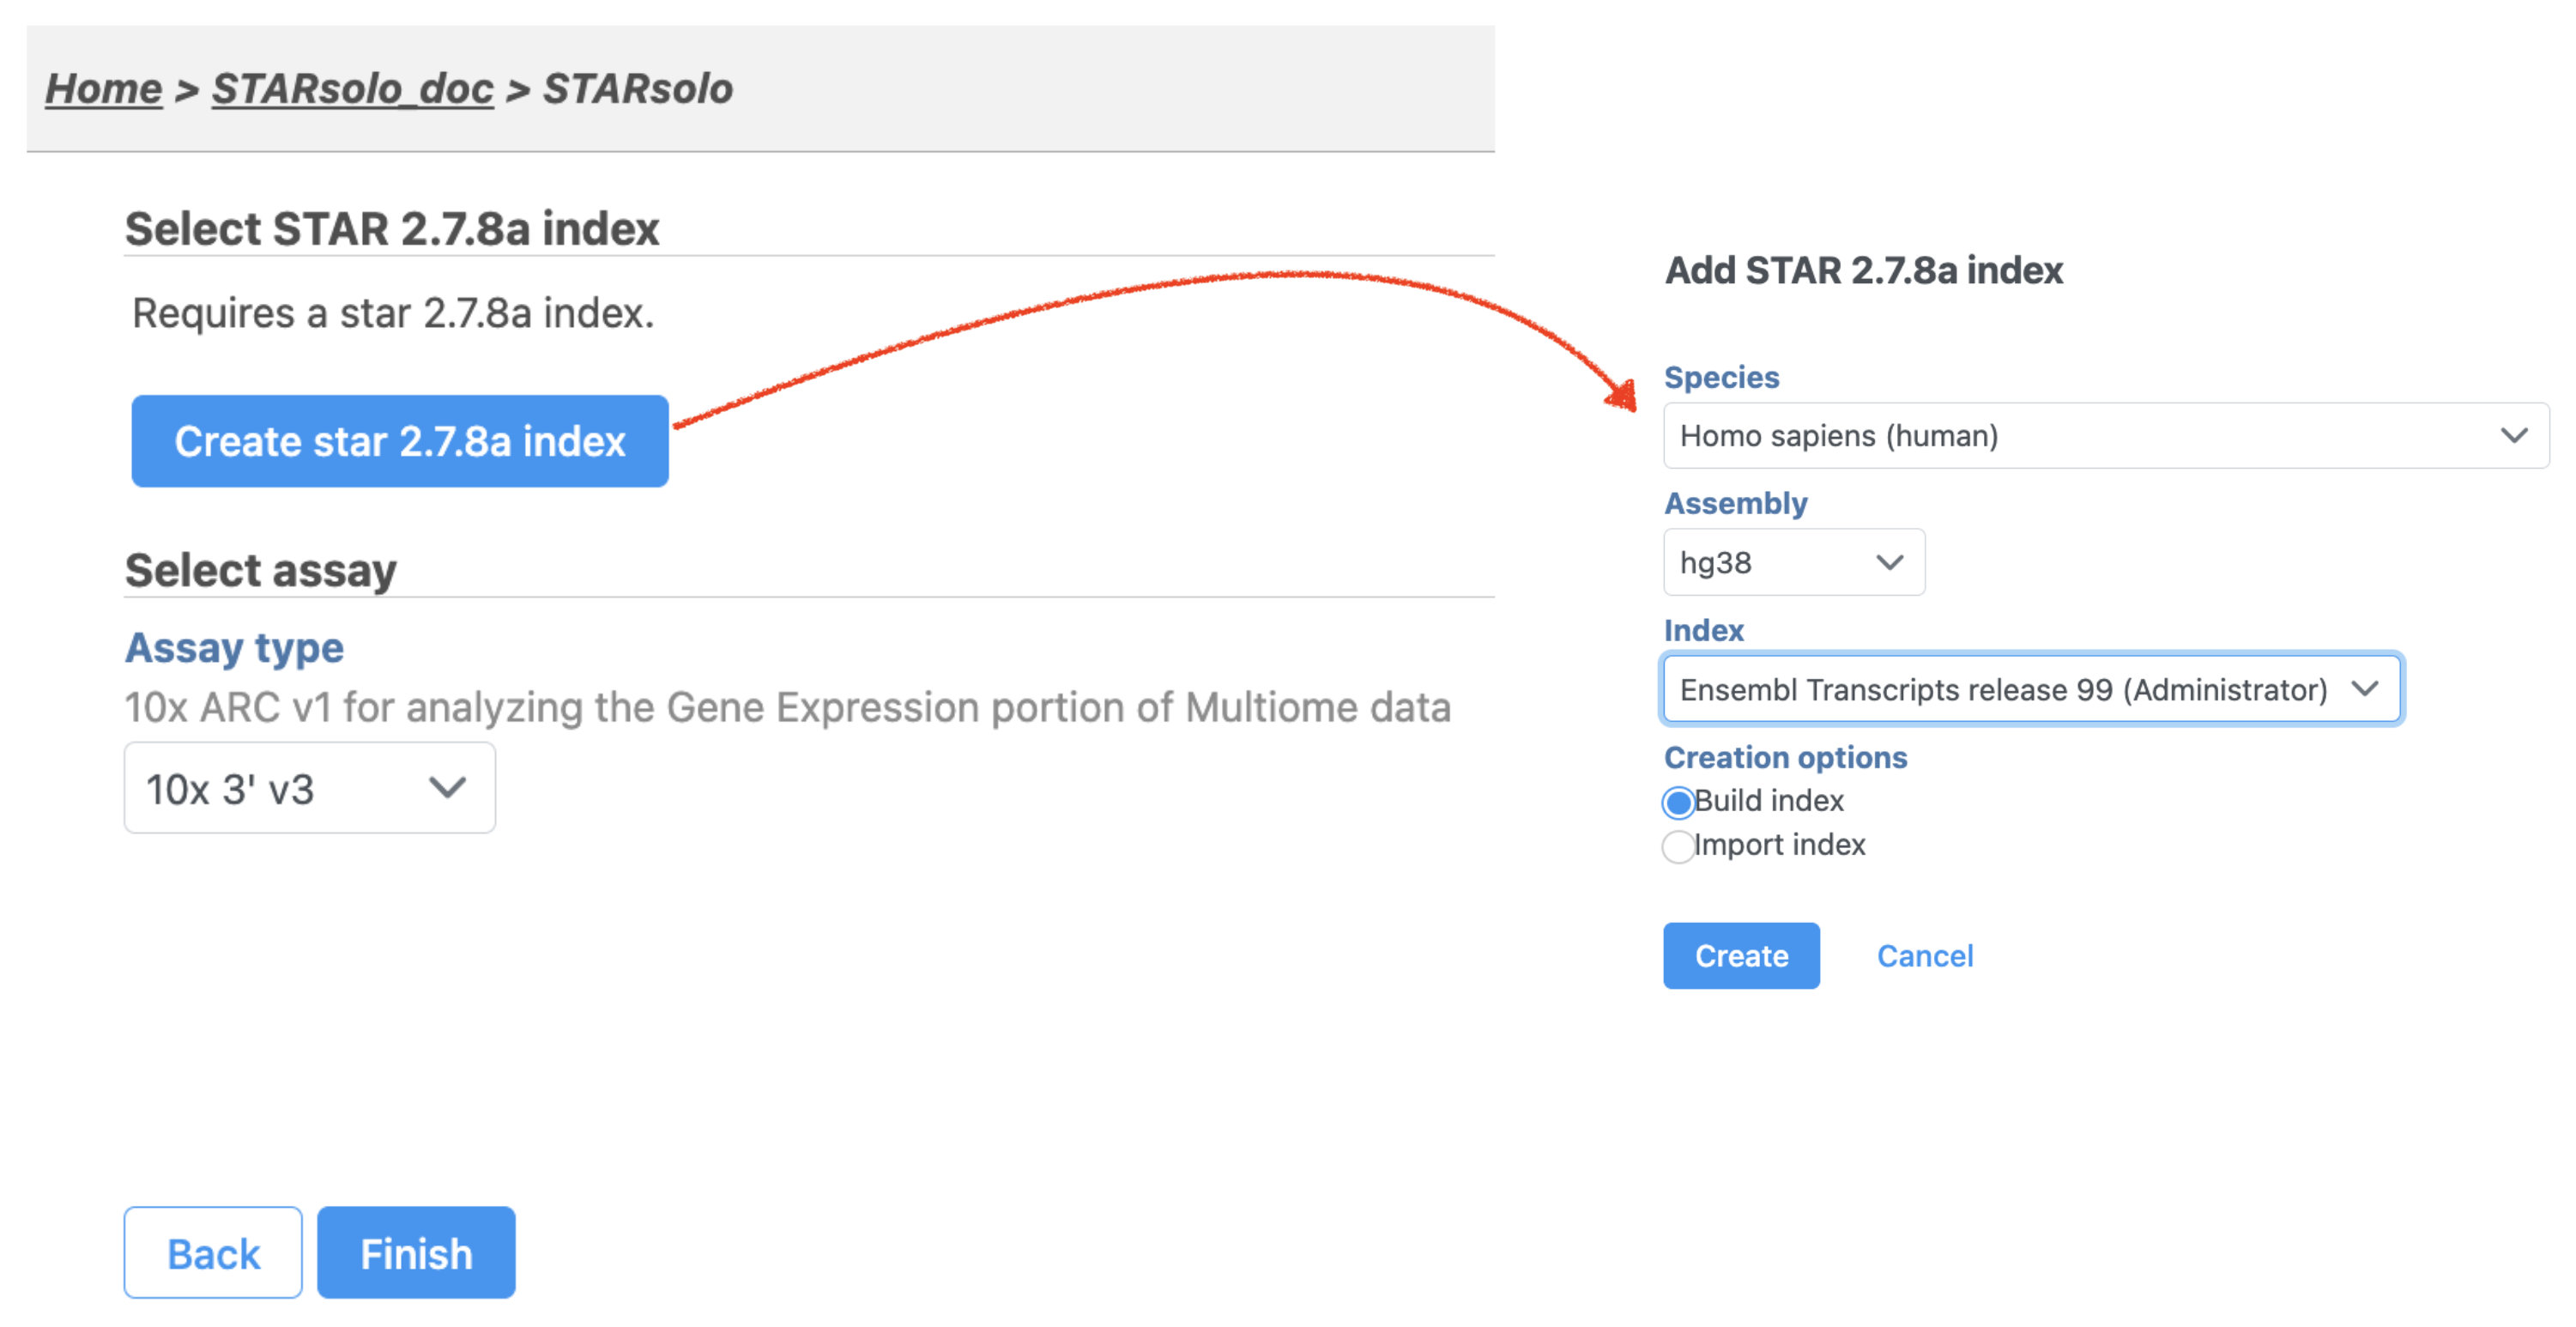
Similar to the Cell Ranger - Gene Expression taskOnce the task has been picked, a first time user will be asked to create a Reference assembly. In Partek® Flow®, we will use Cell Ranger ARC 2.0.0 to create a Reference assembly for all 10x Genomics analysis pipelines. Please refer to our Cell Ranger - Gene Expression task manual on how to build or use Reference assembly.Once the right assembly has been chosen/provided, simply press the Finish button to run the task with default settings. The reference assembly of ‘Homo sapiens (human) - hg38’ has been used as an example here (Figure 2).index file (Figure 2). Clicking the big blue button of Create star2.7.8a index would pop up a new window where lists the requirements that users need to fill in (right panel, Figure 2).
| Numbered figure captions | ||||
|---|---|---|---|---|
| ||||
|
The interface will be different for Single Cell Multiome ATAC + Gene Expression sequencing data because the gene expression data from the very same cell has to be paired with the ATAC-Seq data Once the right options have been chosen, simply press the Create button to finish. The index of ‘ hg38 - Ensembl 99’ has been created as an example here (Figure 3).
| Numbered figure captions | ||||
|---|---|---|---|---|
| ||||
|
After the task has finished successfully, a new data node named Single cell counts will be displayed (Figure 4). This data node contains a filtered peak barcode count matrix for ATAC-Seq data, but a unified feature-barcode matrix that contains gene expression counts alongside ATAC-Seq peak counts for each cell barcode for multiomic data. To open the task report when the task is finished, double click the output data node, or select the Task report in the Task results section after single clicking the data node. The task report (Figure 5) is the same as the ‘Summary HTML’ from Cell Ranger ATAC output.
| Numbered figure captions | ||||
|---|---|---|---|---|
| ||||
|


Cell Ranger - ATAC task report in Flow
The task report is sample based. Users can use the dropdown list on the top left to switch samples. Under the sample name, there are two tabs on each report - Summary report and Data Quality report (Figure 5). Important information on the Estimated Number of Cells, Median high-quality fragments per cell, Fraction of high-quality fragments overlapping peaks, as well as information on Sample, Sequencing, Cells and Cell Clustering are summarized in different panels. Importantly, the Barcode Rank plot and the Fragment Distribution plot have also been included in the Cells section of the Summary report (Figure 5). Descriptions of metrics in the following sections can also be found by clicking the ![]() to the section header in the Summary HTML file itself.
to the section header in the Summary HTML file itself.
| Numbered figure captions | ||||
|---|---|---|---|---|
| ||||
|

The Library Complexity section in Data Quality report plots the observed per cell complexity, measured as median unique fragments per cell, as a function of mean reads per cell (Figure 6). While the Mapping section displays the Insert Size Distribution plot, and metrics derived from it. Single Cell ATAC read pairs produce detailed information about nucleosome packing and positioning. The fragment length distribution captures the nucleosome positioning periodicity. The Targeting section shows profiling of the chromatin accessibility behavior of the library at epigenetically relevant regions in the genome. The Enrichment around TSS plot is helpful to assess the signal-to-noise ratio of the library. It is well known that Transcriptional Start Sites (TSSs) and the promoter regions around them have a higher degree of chromatin accessibility compared to other regions of the genome. The Peaks targeting plot presents the variation in the number of on-target fragments, or fragments that overlap peaks, within each barcode group. A higher percentage of the barcode fragments overlap peaks is expected for cell-associated barcodes.
| Numbered figure captions | ||||
|---|---|---|---|---|
| ||||
|

The task report for multiomic data analysis is more complicated. It contains summary metrics at different levels - ATAC, gene expression, both/joint. Joint view is the default view visible upon first rendering the summary and can be accessed by clicking "Joint" at the top left corner. Metrics that are specific to the given Chromatin Accessibility library will appear in the ATAC tab. Lastly, metrics that are specific to the given gene expression library will appear in the Gene Expression tab (Figure 7). To understand the details, please refer to 10x Genomics webpage[4].
| Numbered figure captions | ||||
|---|---|---|---|---|
| ||||
|

Other adjustable parameters in this task (Figure 2) include:
Subsample percentile: Downsample to preserve this fraction of reads.
Users can also click Configure to change the default settings in Advanced options (Figure 2).
Override peak caller: To override the peak caller, users specify peaks to use in downstream analyses from supplied 3-column BED file. The supplied peaks file must be sorted by position and not contain overlapping peaks; comment lines beginning with `#` are allowed.
Force cells: Define the top N barcodes with the most fragments overlapping peaks as cells and override the cell calling algorithm. N must be a positive integer <= 20,000. Use this option if the number of cells estimated by Cell Ranger -ATAC is not consistent with the barcode rank plot.
Memory limit (GB): Restricts Cell Ranger - ATAC to use specified amount of memory (in GB) to execute pipeline stages.
Import Cell Ranger output into Flow
If users have converted FASTQ outside of Partek, the available count matrix can be imported along with additional files (Figure 8A). Files that Flow will need to complete the import includes the following:
filtered_feature_bc_matrix.h5
per_barcode_metrics.csv (or the name is singlecell.csv)
peaks.bed
fragments.tsv.gz.tbi
fragments.tsv.gz.
Those five files can usually be found in the outs/ subdirectory within the pipeline output directory (Figure 8B). Five files are necessary per sample because scATAC-seq is more complicated than RNA-seq. If peak calling was performed on each sample/dataset independently, the peaks are unlikely to be exactly the same so all of the samples/datasets need to be merged to create a common set of peaks across the samples/datasets; this is performed during data import wherein all of the samples/datasets need to be imported at one time, not separately. To add samples, click the green + button (Figure8A).
| Numbered figure captions | ||||
|---|---|---|---|---|
| ||||
|

Import FASTQs for Cell Ranger -ATAC in Flow
Although the index files (I1 or I2) are optional, we encourage users to include all of the FASTQs in the table (Figure 9) while importing data for Cell Ranger - ATAC.
| Numbered figure captions | ||||
|---|---|---|---|---|
| ||||
|

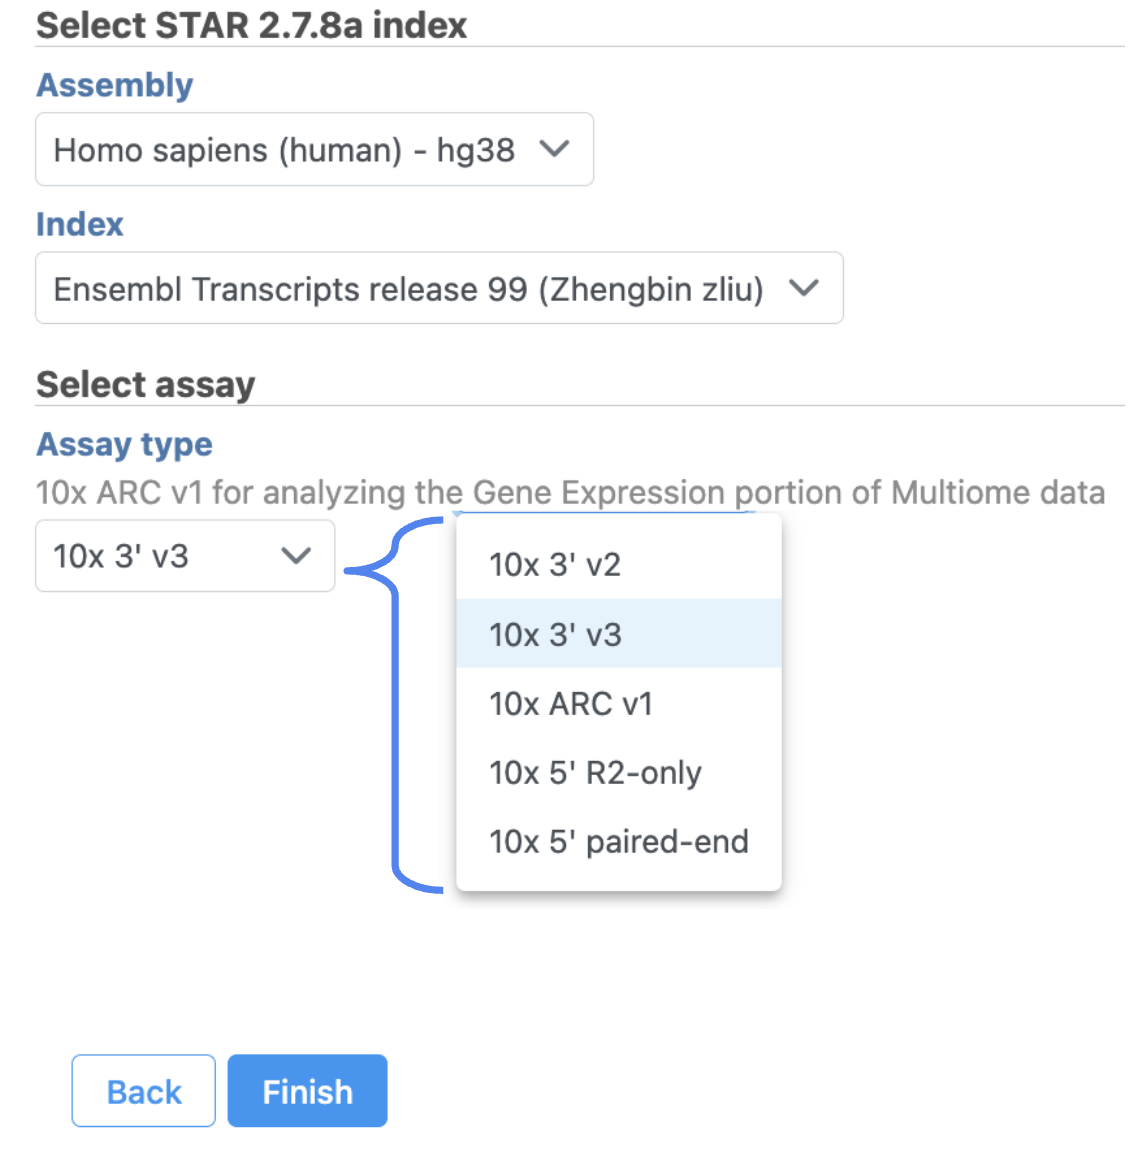
The import of ATAC FASTQ files are as straightforward as the (sc)RNA-Seq data. However, we need to associate the two different types of data together for 10x multiome ATAC + Gene Expression data. This includes two steps: 1). Import the ATAC FASTQ files in the new page after clicking on the "Automatically create samples from files" in Data tab (Figure 10A) and select the data type, as ATAC-Seq, from the dropdown list (Figure 10B). 2). Move back to the Data tab and display all of the files by clicking on the Show data files button at the bottom left of Sample name table. Then click the green + button ![]() (Figure 10C) to add RNA FASTQs to the same sample. Similarly, we will select the data type from the dropdown (mRNA) before we finish the import process by clicking on the Associate file button (Figure 10D). The main task menu will be refreshed as above (Figure 3) for STARsolo task if the index has been added. Users can go ahead select the Assay type before they click the Finish button to run the task. The STARsolo for this version only handles gene expression data no matter where it’s sourced from.
(Figure 10C) to add RNA FASTQs to the same sample. Similarly, we will select the data type from the dropdown (mRNA) before we finish the import process by clicking on the Associate file button (Figure 10D). The main task menu will be refreshed as above (Figure 3) for STARsolo task if the index has been added. Users can go ahead select the Assay type before they click the Finish button to run the task. The STARsolo for this version only handles gene expression data no matter where it’s sourced from.
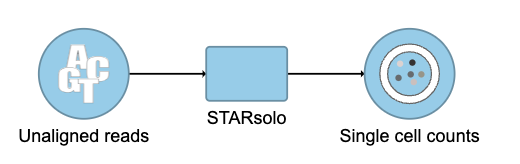
A new data node named Single cell counts will be displayed in Flow if the task has been completed successfully (Figure 4). Downstream analysis such as QA/QC, normalization, dimension reduction, clustering, differential analysis, etc will start from the data node.
| Numbered figure captions | ||||||
|---|---|---|---|---|---|---|
|
| |||||
|

References
- https://support.10xgenomics.com/single-cell-multiome-atac-gex/software/pipelines/latest/output/summary
doi:https://supportdoi.10xgenomics.com/single-cell-gene-expression/software/overview/welcome
https://support.10xgenomics.com/single-cell-atac/software/pipelines/latest/release-notes
- https://support.10xgenomics.com/single-cell-multiome-atac-gex/software/pipelines/latest/what-is-cell-ranger-arc
Additional Assistance
If you need additional assistance, please visit our support page to submit a help ticket or find phone numbers for regional support.
Overview
Content Tools