Page History
| Table of Contentschildren |
|---|
This tutorial presents an outline of the basic series of steps for analyzing a 10x Genomics Gene Expression with Feature Barcoding (antibody) data set in Partek Flow starting with the output of Cell Ranger.
If you are starting with the raw data (FASTQ files), please begin with our Processing CITE-Seq data tutorial, which will take you from raw data to count matrix files. If you have Cell Hashing data, please see our documentation on Hashtag demultiplexing.
...
The data set for this tutorial is a demonstration data set from 10x Genomics. The sample includes cells from a dissociated Extranodal Marginal Zone B-Cell Tumor (MALT: Mucosa-Associated Lymphoid Tissue) stained with BioLegend TotalSeq-B antibodies. We are starting with the Feature / cell matrix HDF5 (filtered) produced by Cell Ranger.
Importing feature barcoding data
...
| Numbered figure captions | ||||
|---|---|---|---|---|
| ||||
|
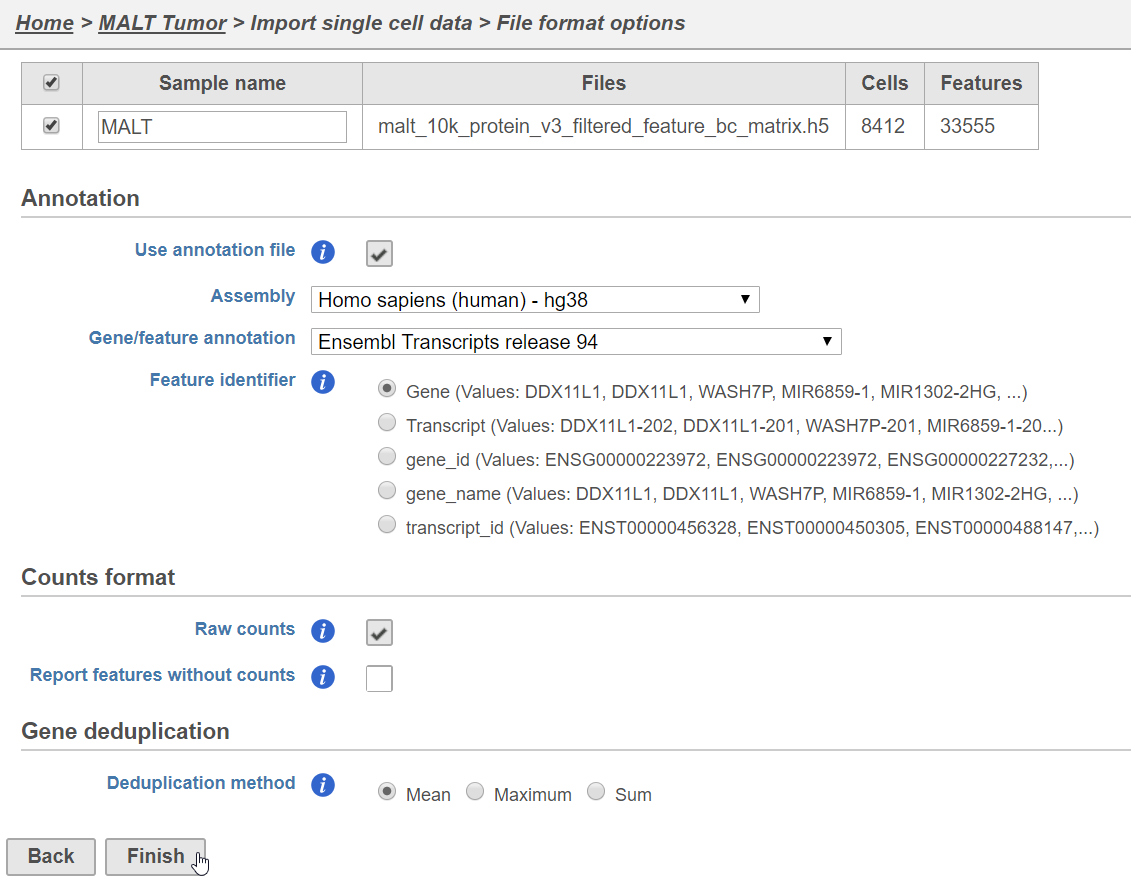
A Single cell counts data node will be created after the file has been imported.
Split matrix
The Single cell counts data node contains two different types of data, mRNA measurements and protein measurements. So that we can process these two different types of data separately, we will split the data by data type.
- Click the Single cell counts data node
- Click the Pre-analysis tools section of the toolbox
- Click Split matrix
A rectangle, or task node, will be created for Split matrix along with two output circles, or data nodes, one for each data type (Figure ). The labels for these data types are determined by features.csv file used when processing the data with Cell Ranger. Here, our data is labeled Gene Expression, for the mRNA data, and Antibody Capture, for the protein data.
| Numbered figure captions | ||||
|---|---|---|---|---|
| ||||
|

Filter low-quality cells
An important step in analyzing single cell RNA-Seq data is to filter out low-quality cells. A few examples of low-quality cells are doublets, cells damaged during cell isolation, or cells with too few reads to be analyzed. In a CITE-Seq experiment, protein aggregation in the antibody staining reagents can cause a cell to have a very high number of counts; these are low-quality cells are can be excluded. Additionally, if all cells in a data set are expected to show a baseline level of expression for one of the antibodies used, it may be appropriate to filter out cells with very low counts. You can do this in Partek Flow using the Single cell QA/QC task.
We will start with the protein data.
- Click the Antibody Capture data node
- Click the QA/QC section in the toolbox
- Click Single Cell QA/QC
This produces a Single-cell QA/QC task node.
- Double-click the Single cell QA/QC task node to open the task report
ROADBLOCK NOTE - right-now it does not recalculate so this actually just creates the same report on both data nodes
ROADBLOCK NOTE - also running Filter cells creates layers instead of running on the branches as expected
Prior to beginning, transfer this file to your Partek Flow using the Transfer files button on the homepage.
| Page Turner | ||
|---|---|---|
|
| Additional assistance |
|---|
| Rate Macro |
|---|
Overview
Content Tools