Page History
...
With a list of enriched regions, you can now identify recurring patterns or motifs in motifs in these regions. A transcription factor can bind to many Transcription factors bind sites throughout the genome. These sites usually share a certain pattern in their sequences termed a consensus sequence, but each has a characteristic sequence it binds - a consensus sequence that appears in most of its binding sites. By searching for these binding site motifs, you can determine the binding site pattern and the locations of binding consensus sequence for a transcription factor and predict potential binding locations throughout the genome that may not have been found in your experiment.
Partek Genomics Suite detects de novo motifs using the Gibbs motif sampler (Neuwald et al., Protein Science, 1995) and can search for known transcription factor binding sites using a database such as JASPAR.
Discover de novo motifs
- Select Motif discovery Discovery from the Peak Analysis section of the ChIP-Seq workflow
- Select Discover de novo motifs
- Select OK
...
- Select 1/p-value_filtered from the Spreadsheet with genomic regions drop-down menu
- Set Number of Motifs to 1
- Set Discover motifs of lengthlength to 6 bp to 16 bp
- Set Result file to Motifs; the default save location is the folder you imported the .bam files from
- Select OK
If you have not previously downloaded the reference genome on your computer, you may be asked if you would like to download the .2bit reference genome. If prompted, select Automatically download a .2bit file then select OK. If Partek Genomics Suite cannot connect to the internet, this option may not be available. If not, you will need to download the .2bit file from the UCSC Genome Browser and import it by selecting Manually selecting Manually specify a .2bit file and choosing the downloaded .2bit file. The reference genome map is required to determine which genes overlap the enriched peak regions and to display the aligned sequences in the Genome Viewer.
A motif visualization tab will , Sequence Logo, will open and two spreadsheets will be generated. One spreadsheet, motifs (Motifs), contains information about the motif. The other, instances (Motifs_instances.txt), lists the genomic locations of the motif.
...
Sequence Logo Window
The Sequence Logo tab (Figure 2) graphically opens after motif detection and displays the best most significant motif found in the regions listed in the source spreadsheet, p_value_filtered.
| Numbered figure captions | ||||
|---|---|---|---|---|
| ||||
|

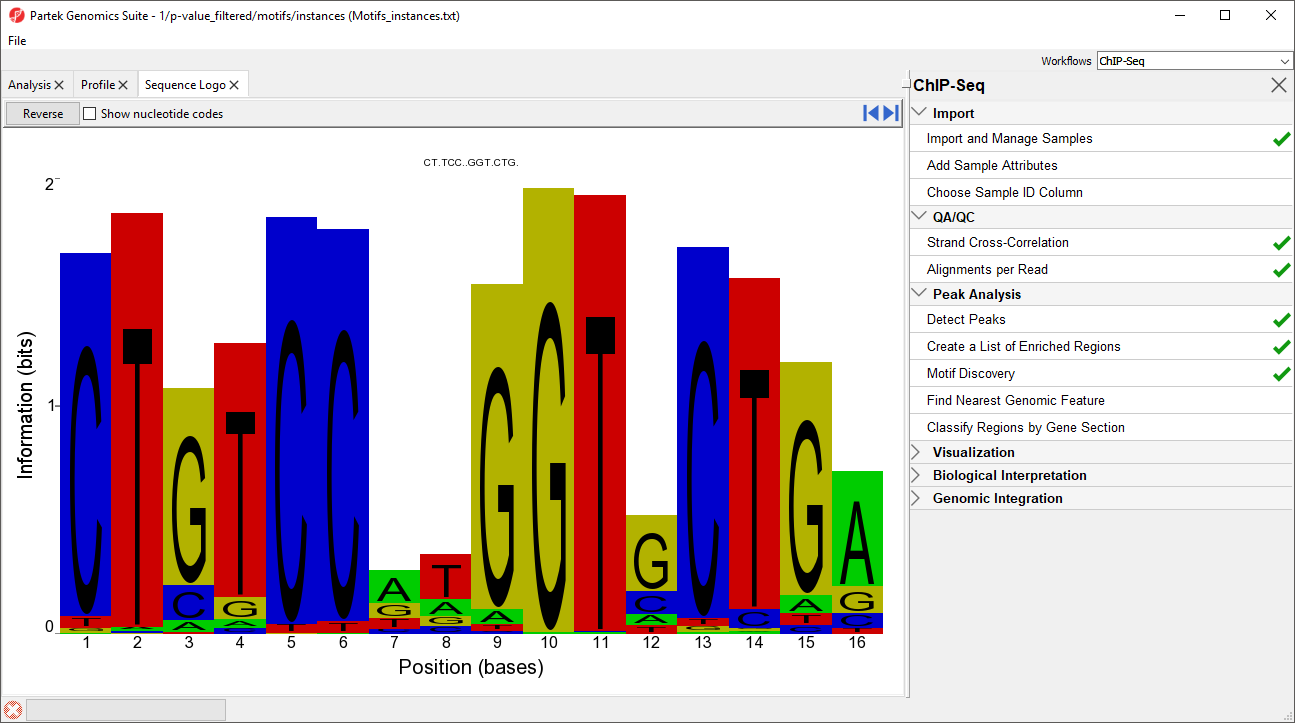
In this case, the motif finder discovered a motif in the NRSF-enriched regions that is 16 base pairs in length. The height of each position is the relative entropy (in bits) and indicates the importance of a base at a particular location in the binding site.
The title CT.TCC..GGT.CTG. is the consensus sequence for the sequence logo. Dots represent position positions that contain more than one significant base across all reads in the motif. The dots can be replaced with characters representing the possible bases at each location by selecting Show nucleotide codes. A description of the IUPAC nucleotide codes is available at the UCSC Genome Browser.
...
| Numbered figure captions | ||||
|---|---|---|---|---|
| ||||
|

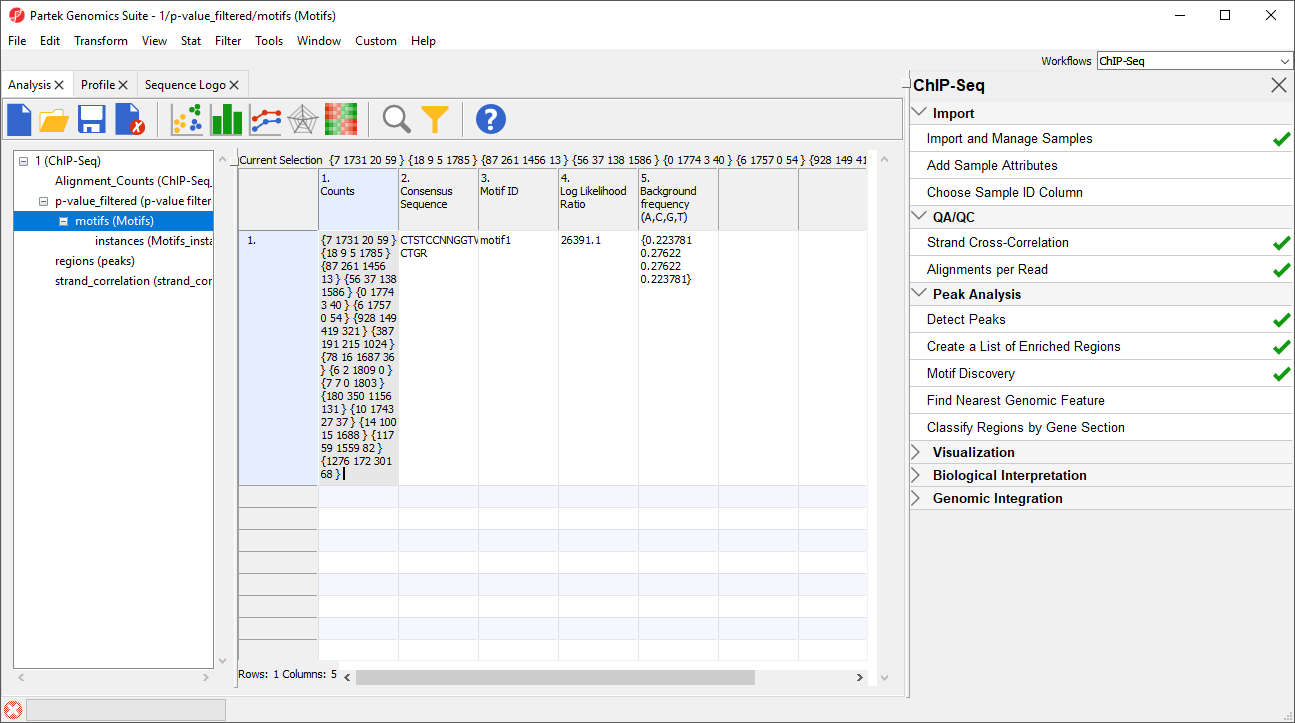
1. Counts gives the summed counts for each base call across all occurrences of the motif in the region list as {A, C, G, T}
...
| Numbered figure captions | ||||
|---|---|---|---|---|
| ||||
|

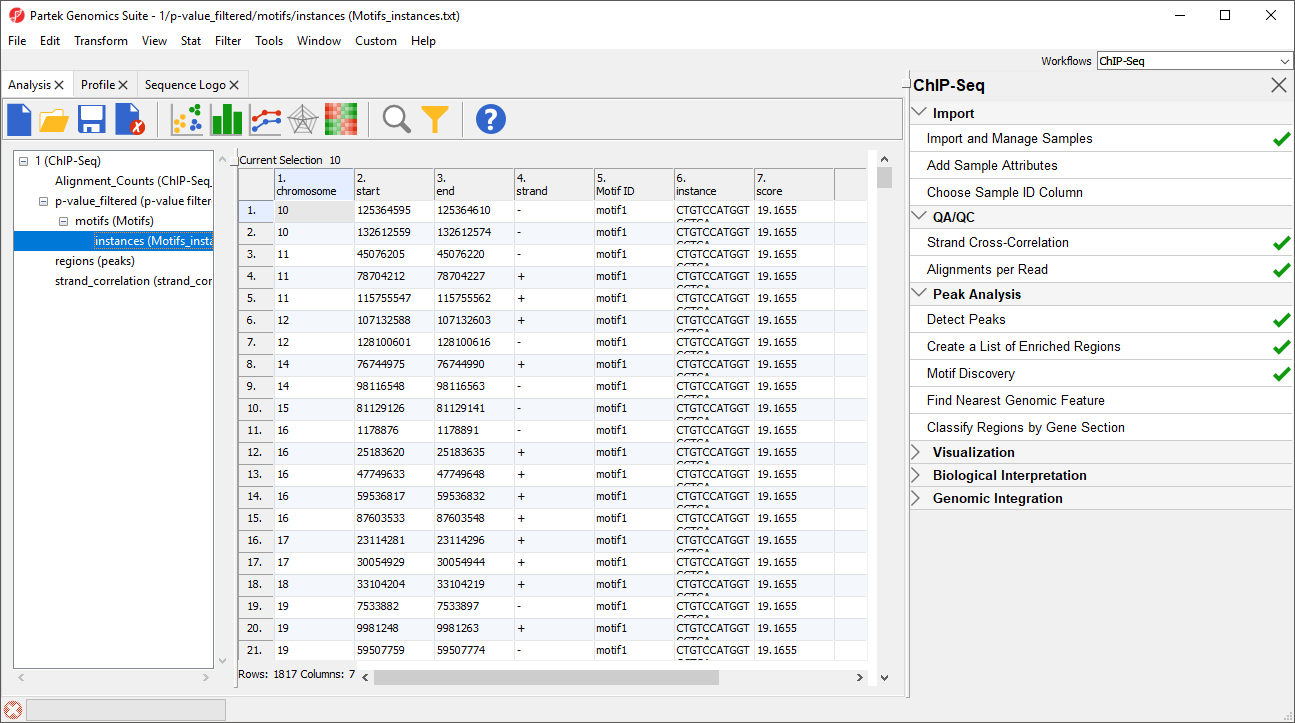
1-4. chromosome, start, stop, strand give the position
...
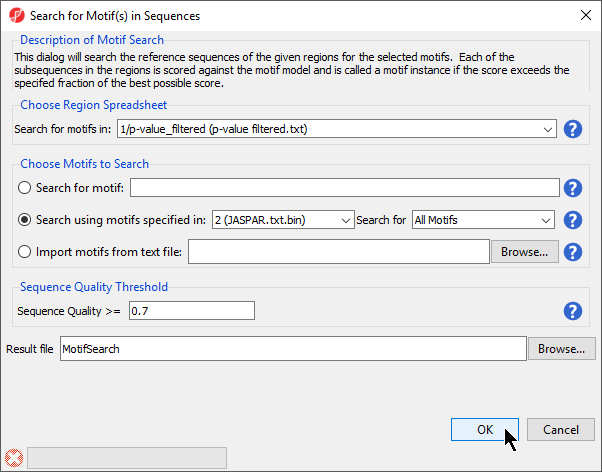
Before Search for known motifs runs, we need to configure the search (Figure 5).
| Numbered figure captions | ||||
|---|---|---|---|---|
| ||||
|
...
Two spreadsheets are created, similar to the spreadsheets in the de novo motif discovery, the motif_summary (MotifSearch) spreadsheet (Figure 67) and the motif_instances (MotifSearch.instance) spreadsheet.
...
| Numbered figure captions | ||||
|---|---|---|---|---|
| ||||
|

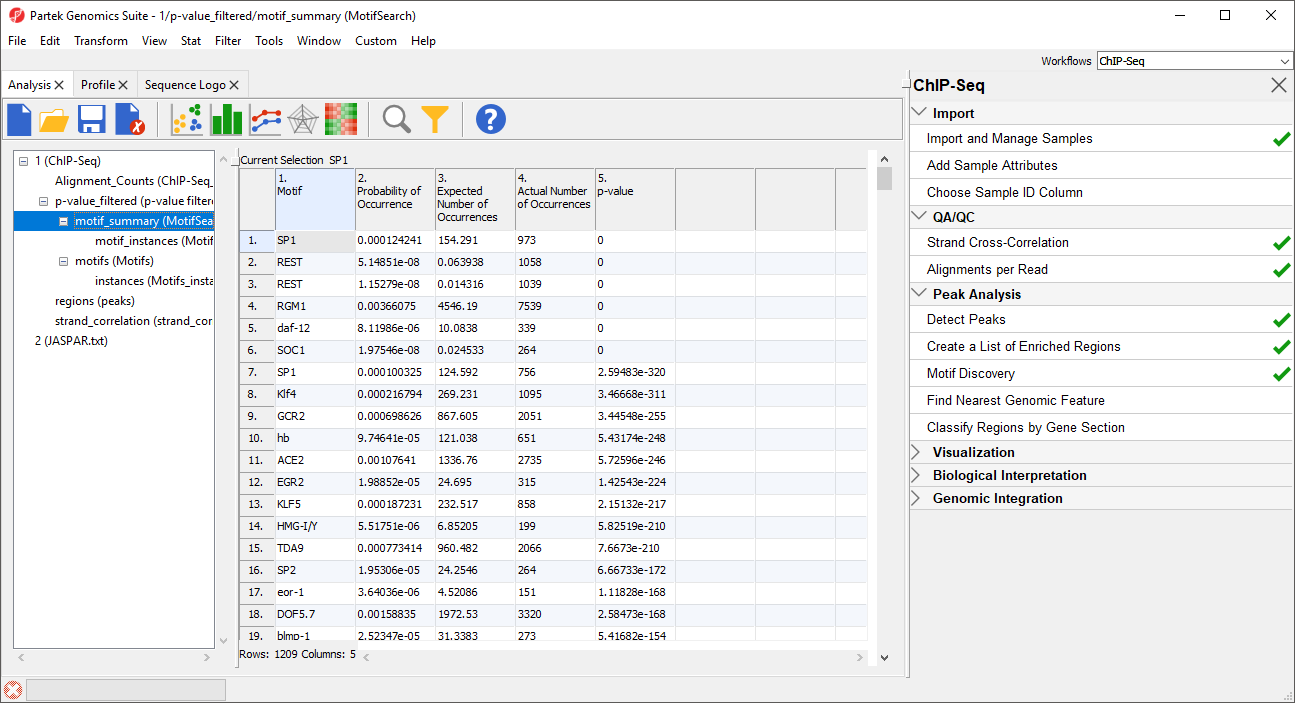
In the MotifSearch spreadsheet, each motif used in the motif search is shown. The columns detail the results of the search for each motif that was found in the reads.
...
As you can see, REST, which is another name for NRSF, is near the top of the list as one of the most significantly over-represented motifs (Figure 67). This motif agrees with the motif found in the de novo motif detection step. Interestingly, other motifs appear a significant number of times in the ChIP-Seq peaks and may represent possible co-factors or regulators.
...
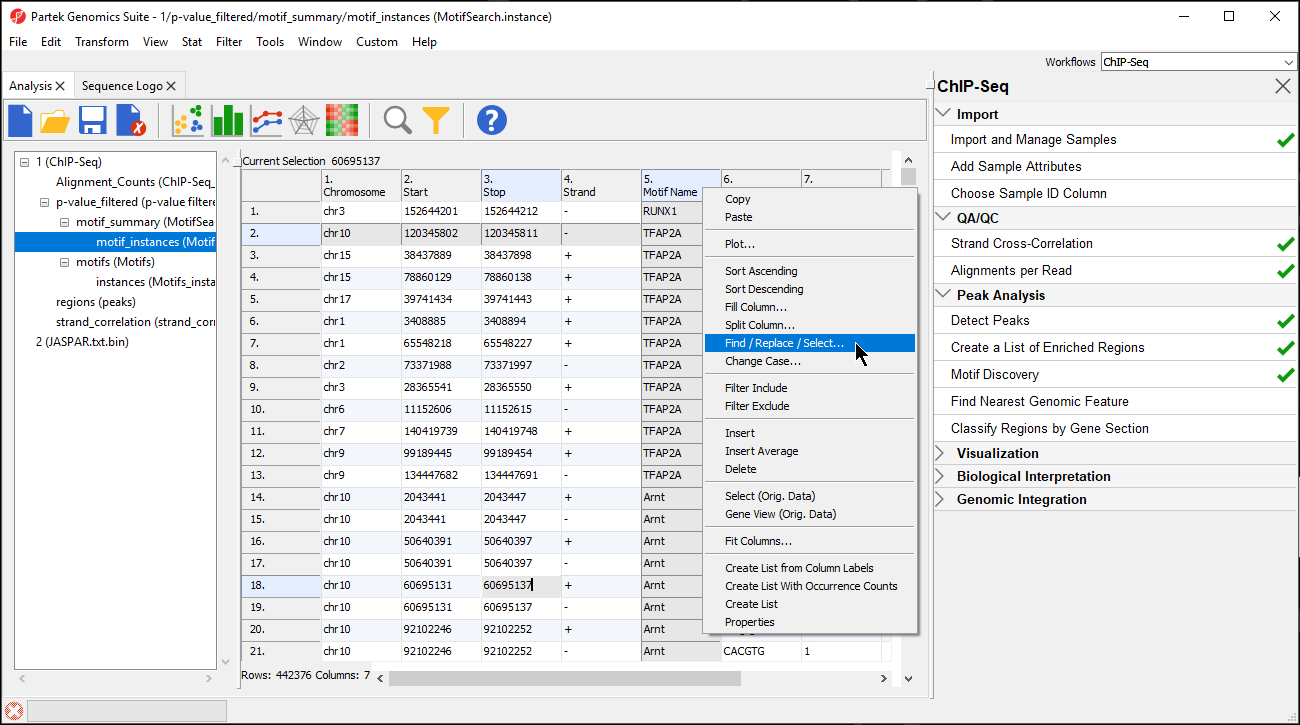
- Select the motif_instances spreadsheet in the spreadsheet tree
- Right-click the 5. Motif Name column
- Select Find / Replace / Select... from the pop-up menu (Figure 7)(8)
| Numbered figure captions | ||||
|---|---|---|---|---|
| ||||
|
- Set Find What: to REST
- Select By Columns for Search:
- Select Only in column with 5. Motif Name selected form the drop-down menu
- Select Select All (Figure 9)
| Numbered figure captions | ||||
|---|---|---|---|---|
| ||||
|
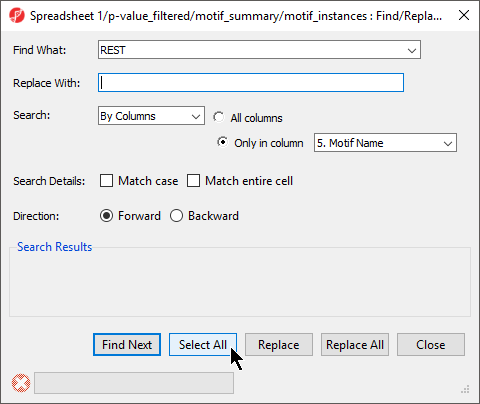
This finds and selects every instance of REST in column 5. Motif Name.
- Select Close
In the motif_instances spreadsheet the selected columns are highlighted.
- Right-click on the first highlighted row visible; in this example, we see row 1319613196
- Select Filter Include from the pop-up menu (Figure 10)
| Numbered figure captions | ||||
|---|---|---|---|---|
| ||||
|
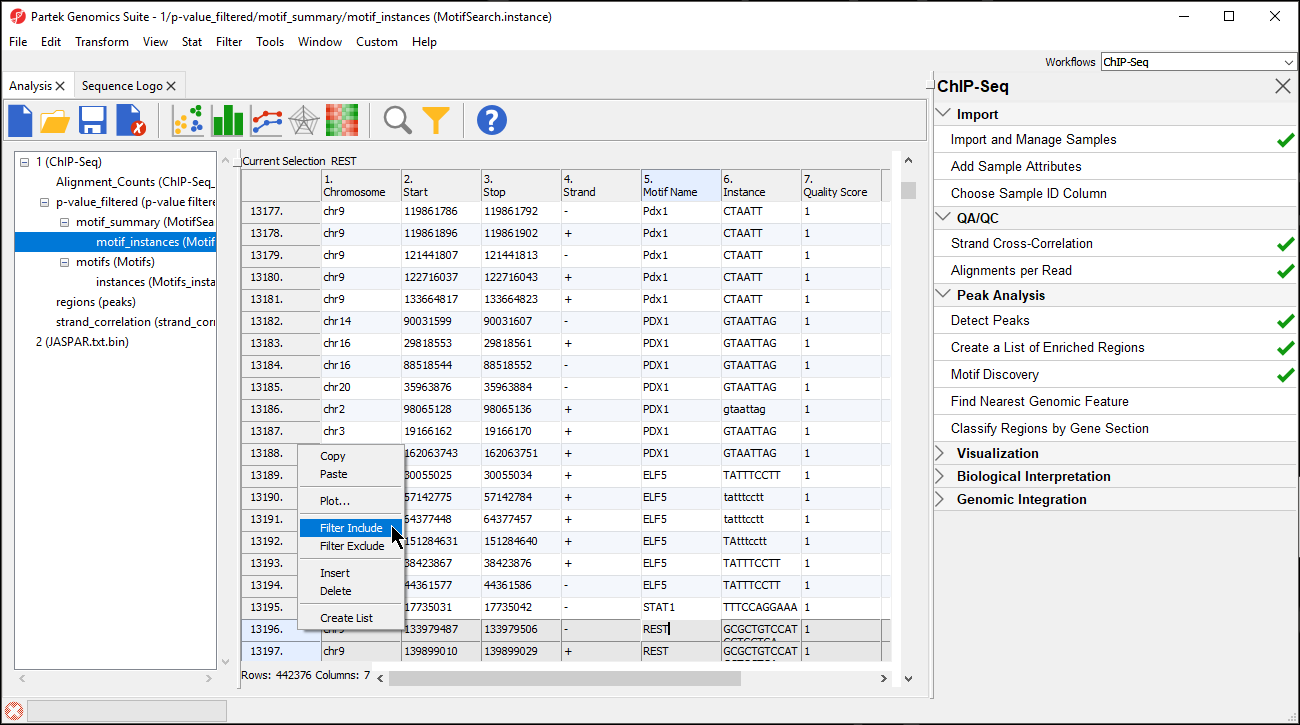
The spreadsheet will now include 2098 rows and a black and yellow bar will appear on the right-hand side of the spreadsheet (Figure 811). The black and yellow bar is a filter indicator showing the fraction of the spreadsheet currently visible as yellow and the filtered fraction as black.
...
- Select rest from the spreadsheet tree
- Select (
 ) from the command bar
 - Name the file REST
- Select Save
...
- Select motif_instances from the spreadsheet tree
- Right-click the filter bar
- Select Clear Filter
References
Neuwald, A. F., Liu, J.S., & Lawrence, C.E. (1995). Gibbs motif sampling: detection of outer membrane repeats (Vol. 4). Protein Science.
| Page Turner | ||
|---|---|---|
|
| Additional assistance |
|---|
|
| Rate Macro | ||
|---|---|---|
|
Overview
Content Tools