Page History
...
- Click the counts data node
- Click the Exploratory analysis section of the toolbox
- Click Graph-based clustering
- Configure the parameters
- Click Finish to run
Graph-based clustering produces a Clustering result data node. The task report lists the cluster results and cluster statistics (Figure 1). If clustering was run with Split cells by sample enabled on a single cell counts data node, the cluster results table displays the number of clusters found for each sample and clicking the sample name opens the sample-level report.
...
The Maximum modularity is a measure of the quality of the clustering result. Modularity measures how much cells within a cluster are similar to each other and less similar to cells in other clusters. Higher modularity indicates a better result. Optimal modularity is 1, but may not be attainable for the input data.
Cluster statistics
The total number of clusters is listed along with the number and percentage of cells in each cluster.
...
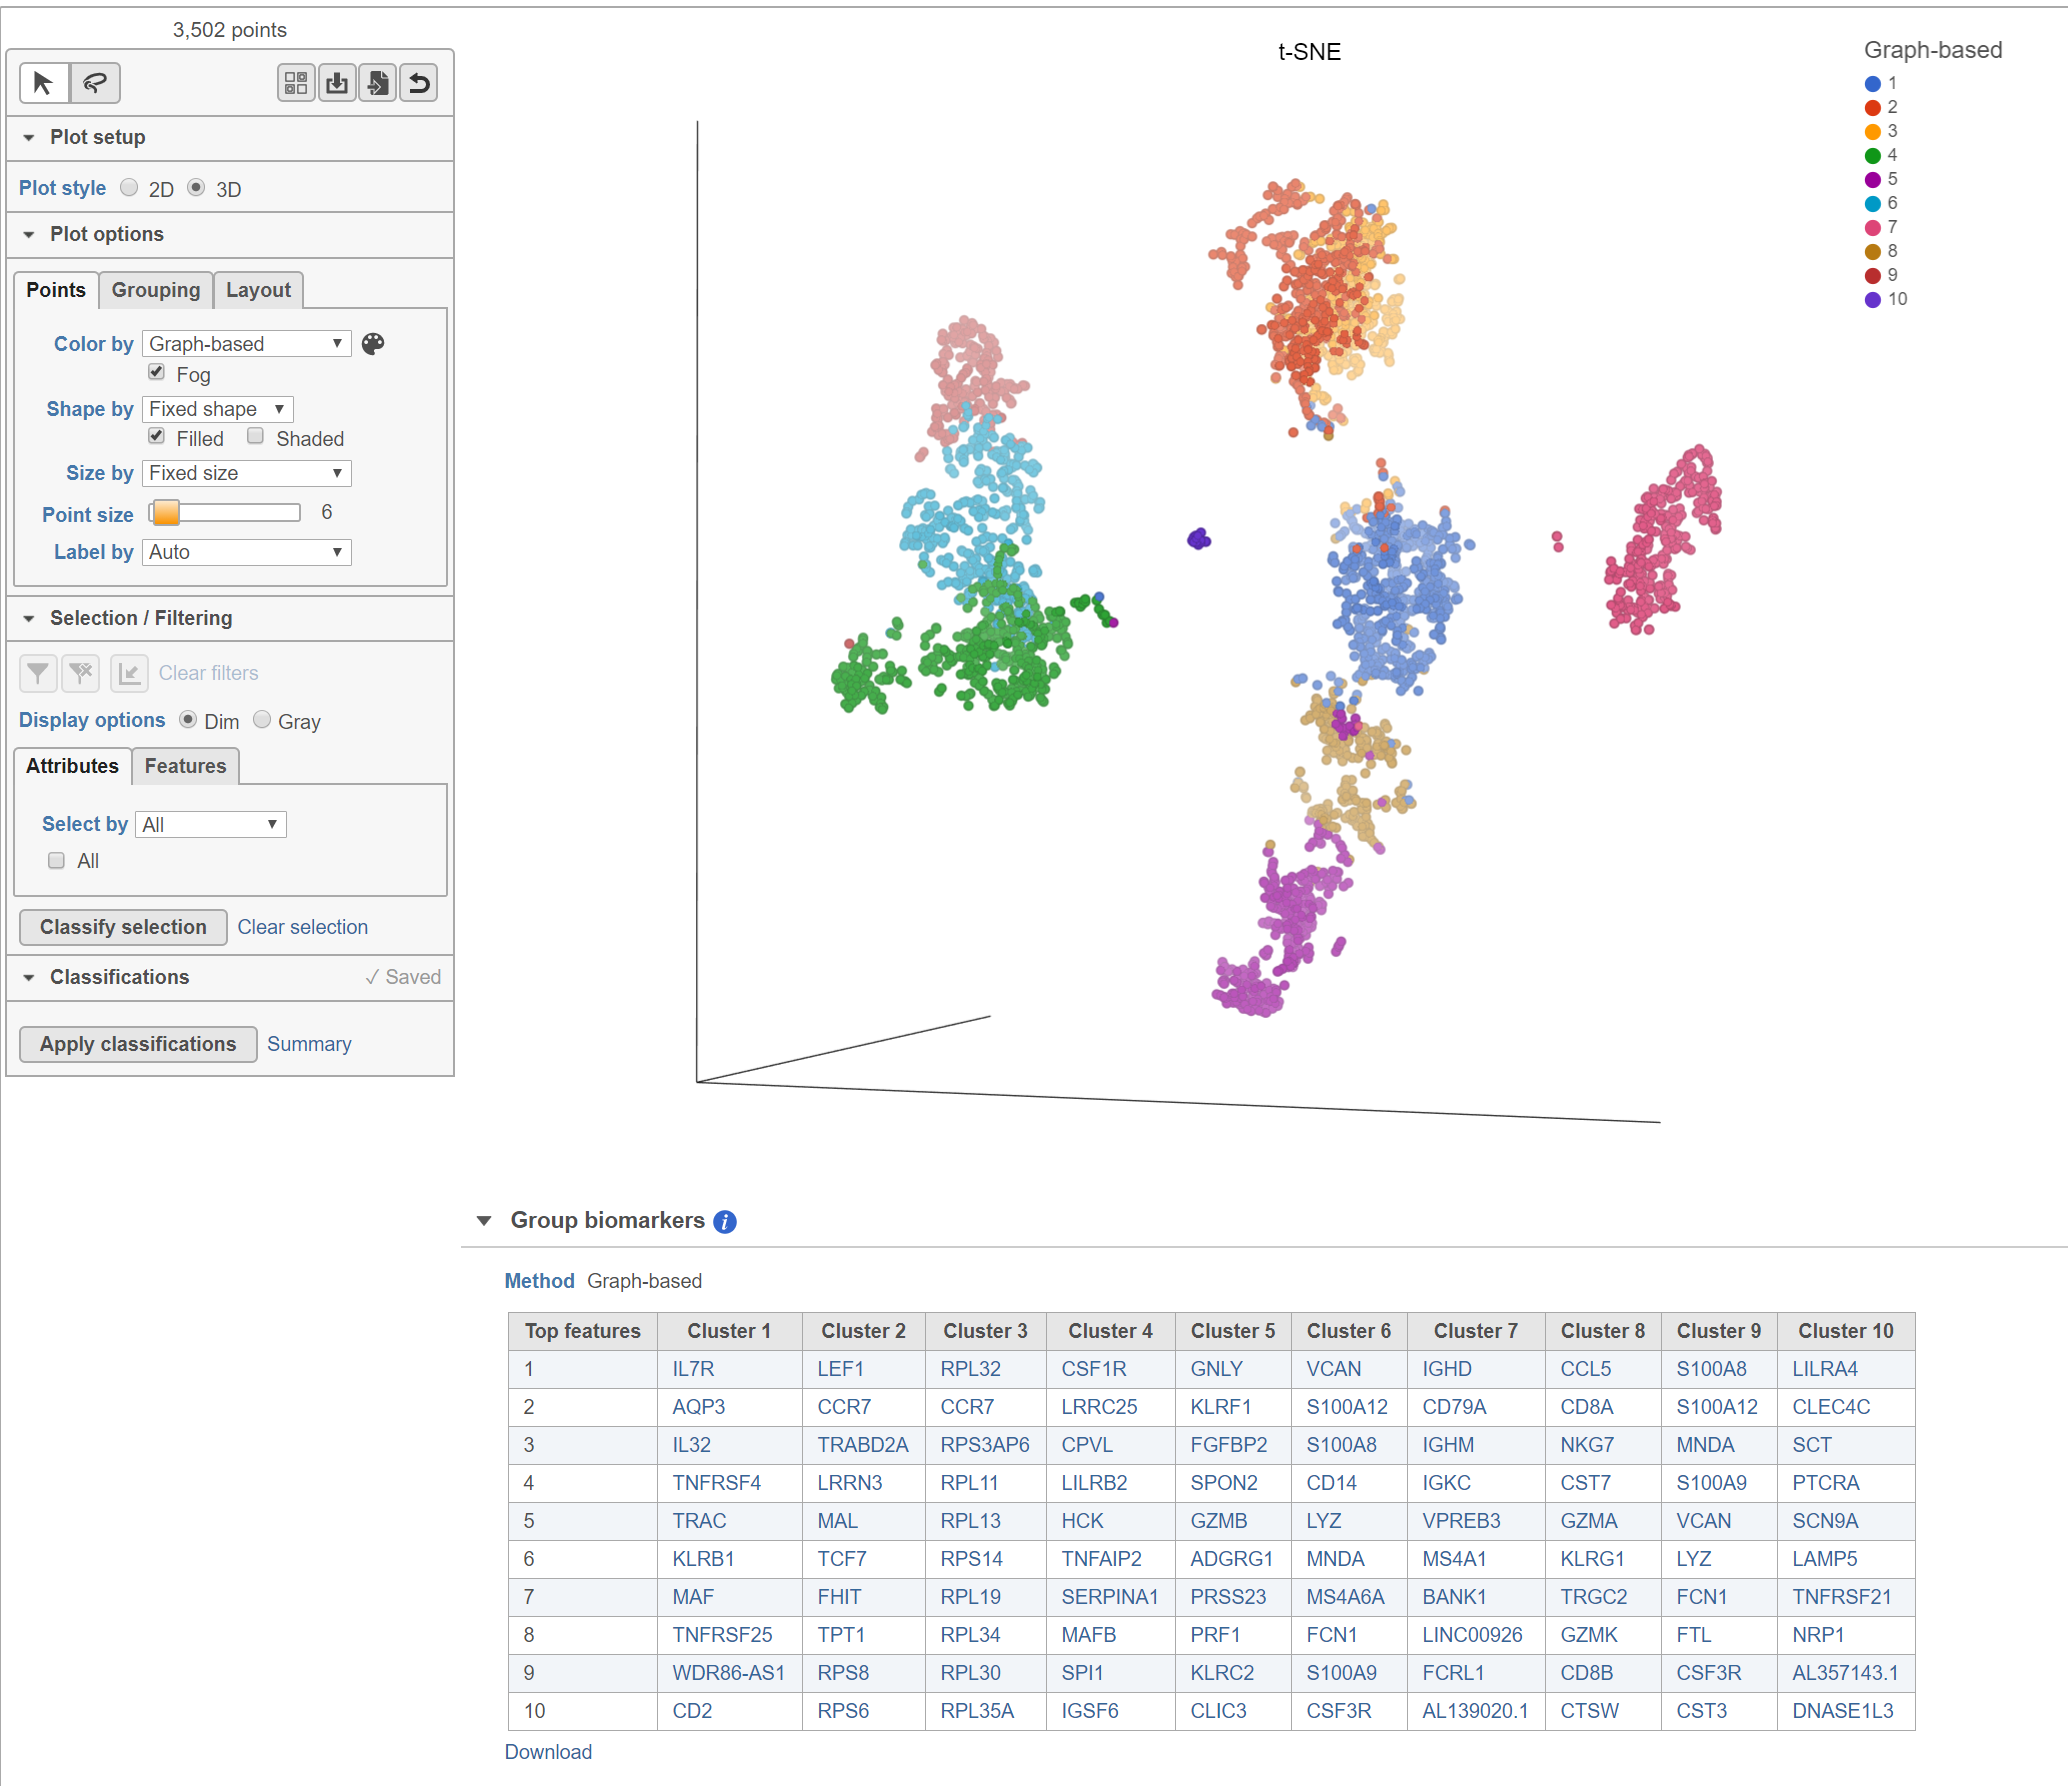
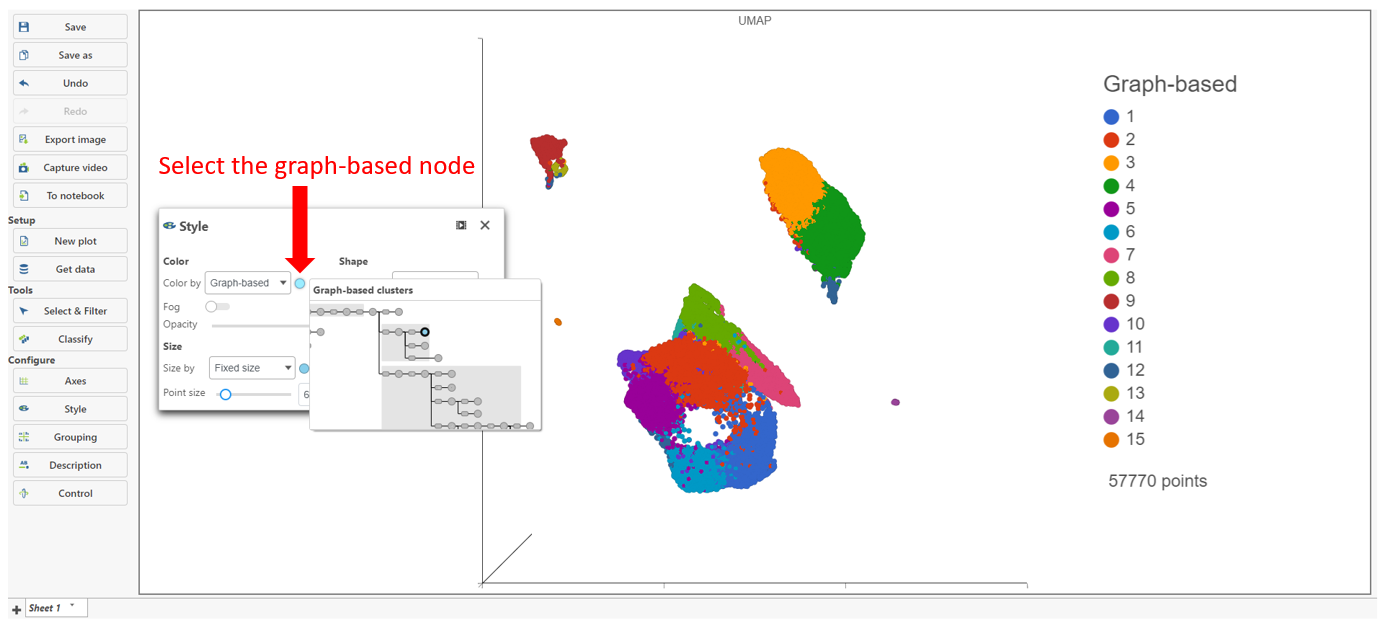
The Clustering result data node includes the input values for each gene and adds cluster assignment as a new attribute, Graph-based, for each observation. If the Clustering result data node is visualized by Scatter plot, PCA, t-SNE, or UMAP, the plot will be colored by the Graph-based attribute and the group biomarker table, if generated, will be included below the plot (Figure 2).
| Numbered figure captions | ||||
|---|---|---|---|---|
| ||||
|
Basic Graph-based clustering parameters
...
Overview
Content Tools