Page History
...
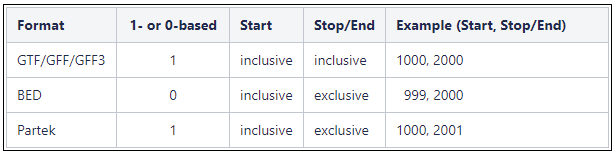
Genome coordinates for annotation models stored in Partek Flow are 1-based, start-inclusive, and stop-exclusive. This means that the first base position starts from one, the start coordinate for a feature is included in the feature and the stop/end coordinate is not included in the feature. These are the genome coordinates that are printed in various task reports and output files when an annotation model is involved in the task. When custom annotation files are added to Partek Flow, the genome coordinates are converted into this format. The coordinates are converted back if necessary for a specific task. shows how the genome coordinates vary between different annotation formats.
Can I add transgenes to my reference files?
...
The Flip mode and download all data options are disabled if there are more than 2.5 million values (rows x columns) in the heatmap.
How to label gene names on volcano plot?
By default, genes are selected if the p-value is <=0.05 and |fold change| >=2 and when the number of selected genes is less than 2000 genes, they will be labeled. You can click on Style button in Configure section, choose a gene annotation field from the Label by drop-down list to change the label. If you number of selected genes is select less than or equal to 100, Partek Flow will try to spread out labels as much as possible to clearly display the labels. If number of selected genes is more than 100, labels will be next to the selected genes, there will be overlaps where genes are close together. If there are more than 2000 genes selected, no label will be displayed.
If you click any blank space, you can turn off select and use different selection mode button on the vertical bar on the upper-right corner of the plot to manually select dots on the plot.
Statistics
Why do I get "?" for FDR p-values in my Deseq2 result?
...
Fold change indicates the extent of increase or decrease in feature expression in a comparison. In Partek Flow, fold change is in linear scale (even if the input data is in log scale). It is converted from ratio, which is the LSmean of group one divided by LSmean of group two in your comparison. When the ratio is greater than 1, fold change is identical to ratio; when the ratio is less than 1, fold change is -1/ratio. There is no fold change value between -1 to 1. When ratio/fold change is 1, that means there is no change between the two groups.
Log ratio option in Partek Flow is converted from ratio, this is a value comparable to log fold change in some other tools.
Can I label a Volcano plot with gene names?
...
Overview
Content Tools