Page History
...
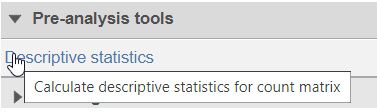
- Click on a counts data node
- Choose Descriptive Statistics in Pre-analysis tools Statistics section of the toolbox (Figure 1)
| Numbered figure captions | ||||
|---|---|---|---|---|
| ||||
|

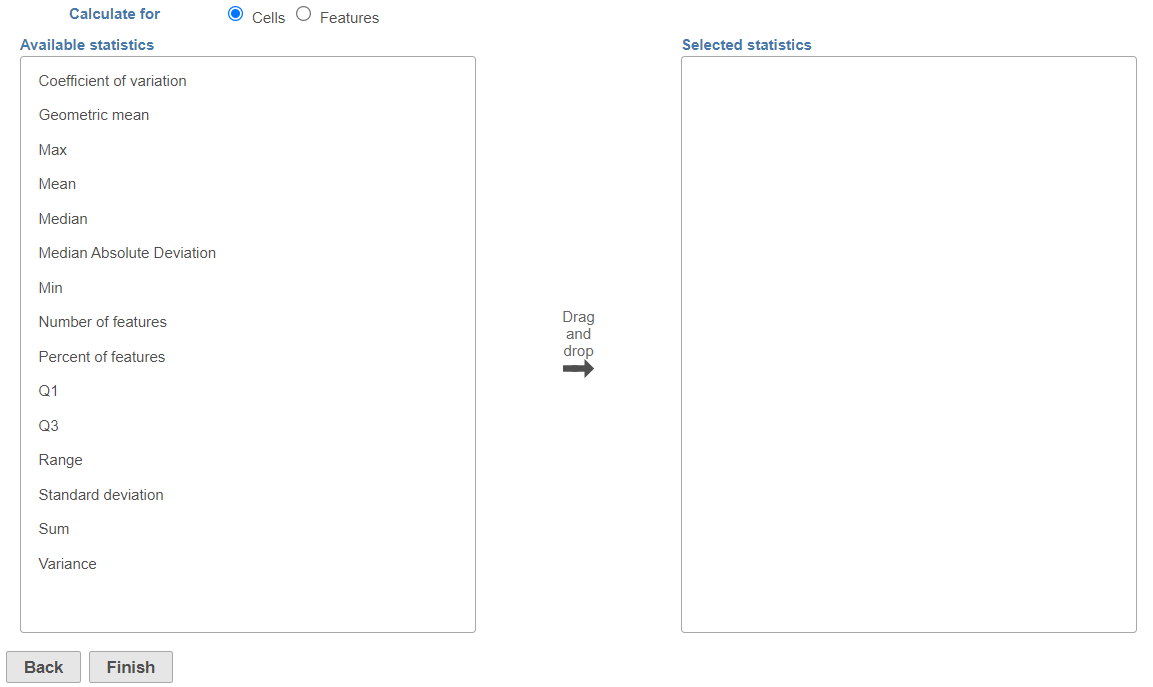
This will invoke the dialog , select the calculation configuration dialog; use it to specify which calculation(s) will be performed on cells (or samples for a bulk analysis data node) (Figure 2) or features (Figure 3). Use the Group by option (available for feature-level report) to report the selected statistics per group (e.g. mean and standard deviation per cell type); pick a group from the drop down list and then push the green cross (![]() ) add it.2).
) add it.2).
| Numbered figure captions | ||||
|---|---|---|---|---|
| ||||
|
| Numbered figure captions | ||||
|---|---|---|---|---|
| ||||
|

The available statistics are listed on the left panel, suppose "x1, x2, ..., xn"represent an array of numbers
- Coefficient of variation (CV):
 s represent the standard deviation
 - Geometric mean: g=

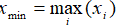
- Max:
- Mean:

- Median: when n is odd, median is
 , when n is even, median is
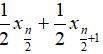
- Median absolute deviation:
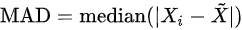 , where
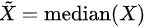
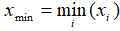
- Min:
- Number of cells: This option reports the absolute number of cells whose
- Non zero percent: percentage of observations that is not zero
- Available when Calculate for is set to Features. Reports the number of cells with the value [<, <=, =, !=, > >=] (select one from the drop down list) than the cut off value entered in the text box. The cut off will be applied to the values present in the input data node, i.e. if invoked on non-normalised data node, the values are raw counts. For instance, use this option if you want to know the number of cells in which each feature was detected; possible filter: Number of cells whose value > 0.0
- Percent of cells: Available when Calculate for is set to Features. Reports the number of cells with the value [<, <=, =, !=, > >=] (select one from the drop down list) than the cut off value entered in the text box.
- Number of features: Available when Calculate for is set to Cells. Reports the number of features with the value [<, <=, =, !=, > >=] (select one from the drop down list) than the cut off value entered in the text box. The cut off will be applied to the values present in the input data node, i.e. if invoked on non-normalised data node, the values are raw counts. For example, use this option if you want to know the number of detected genes per each cell; filter: Number of features whose value > 0.0
- Percent of features: Available when Calculate for is set to Cells. Reports the fraction of features with the value [<, <=, =, !=, > >=] (select one from the drop down list) than the cut off value entered in the text box.
- Q1: 25th percentile
- Q3: 75th percentile
- Range: xmax - x min
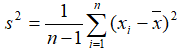
- Standard deviation:
 where
where 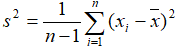
- Sum:

- Variance:
...
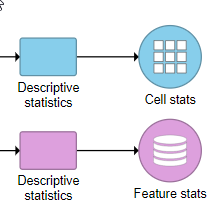
The output of the task is a matrix, it : Cell stats (result of Calculate for Cells) or Feature stats (result of Calculate for Features) (Figure 4). The results can be visualized in the Data Viewer.
| Numbered figure captions | ||||
|---|---|---|---|---|
| ||||
|
| Additional assistance |
|---|
| Rate Macro | ||
|---|---|---|
|
...
Overview
Content Tools