Page History
...
| Numbered figure captions | ||||
|---|---|---|---|---|
| ||||
|
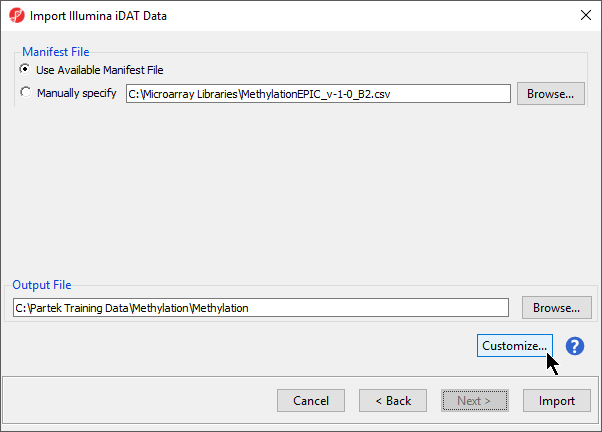
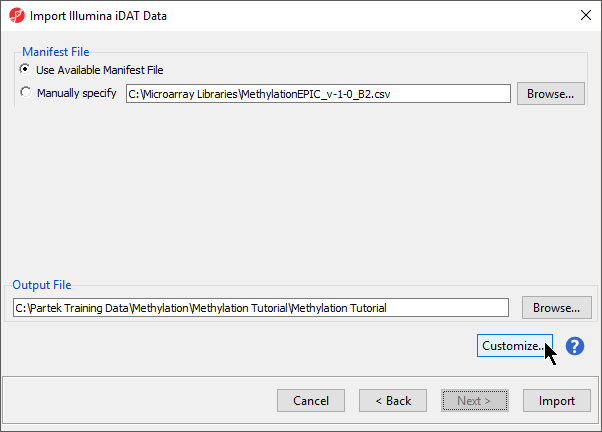
- Select Customize... to open the Advanced Import Options dialog
- Choose No normalization in the Normalization section of the Algorithm tab
- Select the Outputs tab (Figure 2)
| Numbered figure captions | ||||
|---|---|---|---|---|
| ||||
|
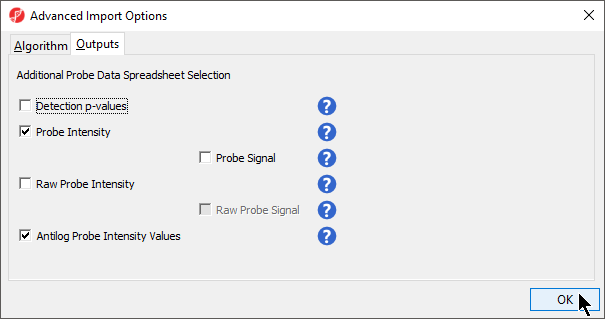
Information about the different output options can be found by selecting the adjacent (![]() ) icon.
) icon.
...
Antilog Probe Intensity Values. Selecting this checkbox will show the probe intensity data without log2 transformation.
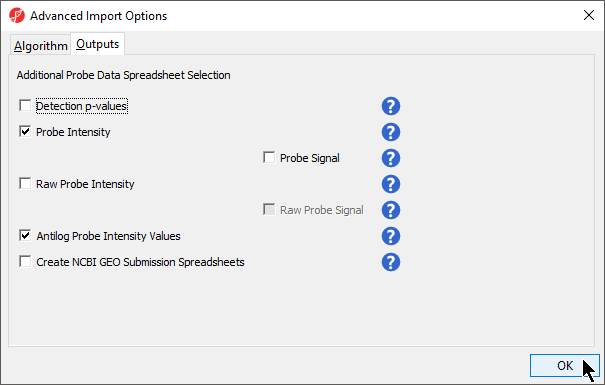
Create NCBI GEO Submission Spreadsheets. Generates matrix processed and matrix signal intensities spreadsheets for GEO submission.
How you proceed depends on your study design. Here is an example series of steps to prepare the tutorial data set for copy number analysis:
- Select Probe Intensity and Antilog Probe Intensity Values (Figure 2)
- Select OK to close the Advanced Import Options dialog
- Select Import to import the data and perform the selected normalization method
- Select the (_probe) spreadsheet from the spreadsheet tree
- Delete any samples with _detectionp names
- Create sample attributes , and assign samples to the groups , and filter as described in Annotate samples
- Select Transform from the main toolbar
- Select Normalize to baseline
...
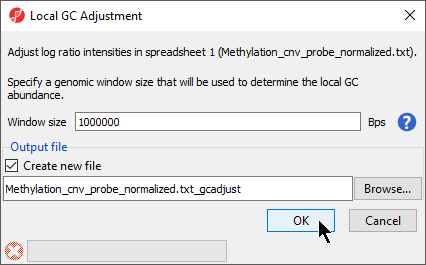
This spreadsheet contains copy number values per probe in log2 space (i.e. diploid = 0). This Prior to performing copy number analysis, you can normalize for local GC abundance.
- Select Transform
- Select Adjust Based on Local GC Content...
- Click OK to run Local GC Adjustment (Figure 4)
| Numbered figure captions | ||||
|---|---|---|---|---|
| ||||
|
...
Overview
Content Tools