Page History
The Usage report section requires a Usage report license and is only available for user accounts with Administrator status. This section allows you to create customized reports on certain usage statistics such as disk usage and project count. These reports can be drafted for a certain date range, allowing you to monitor resource usage over defined periods of time.
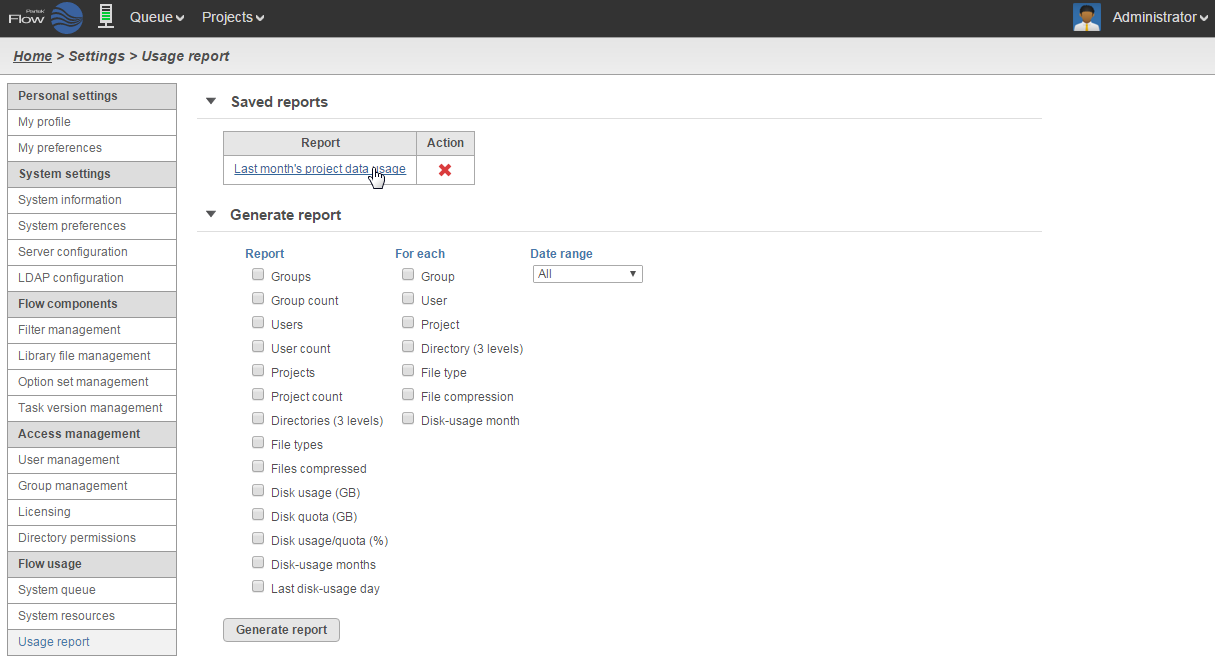
The Saved reports section lists previously-generated usage reports that have been saved by the user (Figure 51). These can be used to review former reports generated. Click on the button
button to delete any saved reports.
| Numbered figure captions | ||||
|---|---|---|---|---|
| ||||
|

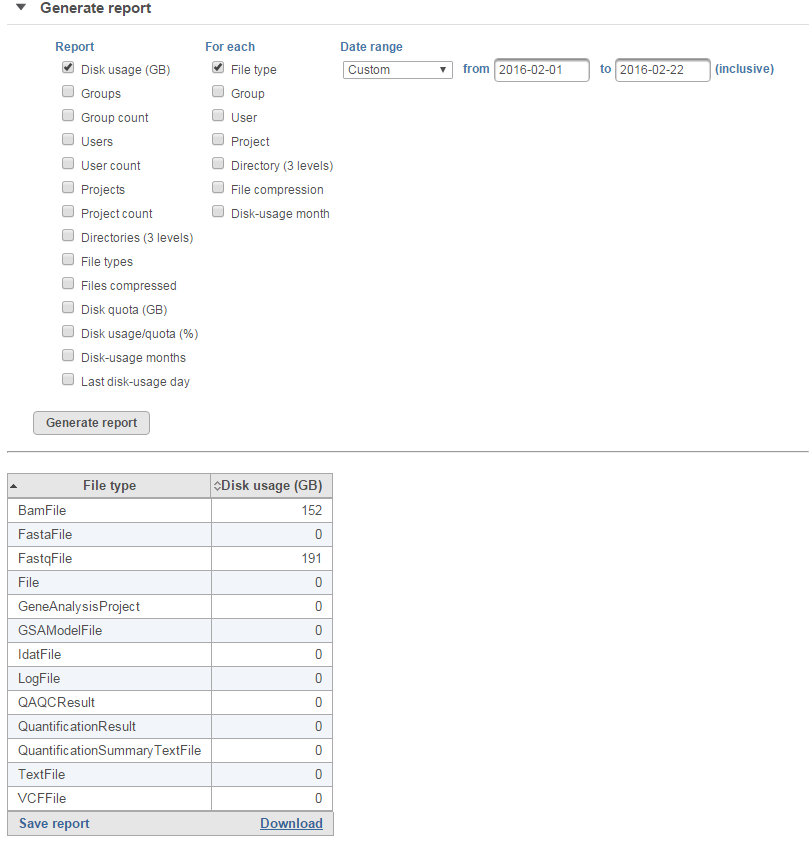
To generate a usage report, go to the Generate report section. Select the following:
The metric you would like reported (Report)
How you would like the information grouped (For each)
The Date range to be reported
For instance, Figure 6 2 shows the creation of a disk usage report for each project within a custom date range.
| Numbered figure captions | ||||
|---|---|---|---|---|
| ||||
|


After selecting your options, click the Generate report button. The usage report will be displayed at the bottom of the page as a table (Figure 73). Click on the Save report link at the lower left corner of the table to save the report. To download the report as a tab-delimited text file, click the Download link at the lower right corner of the table.
| Numbered figure captions | ||||
|---|---|---|---|---|
| ||||
|

| Additional assistance |
|---|
|
| Rate Macro | ||
|---|---|---|
|
Overview
Content Tools