Page History
| Table of Contents | ||||||
|---|---|---|---|---|---|---|
|
Sort rows Rows by prototype Prototype is a function that can identify genes with similar expression patterns. For example, if a gene with an interesting expression pattern has been detected, using Sort Rows by prototype Prototype makes it possible to find other genes that have a similar pattern of intensity values. Although this is most commonly used for changes in gene expression over a time course, it can be applied to other experimental designs as well.
To invoke Sort rows Rows by prototypePrototype, probe(sets)/genes must be on rows. If you want to use this tool to analyze the main intensity values spreadsheet, the spreadsheet must be transposed prior to analysis. A common way to view and analyze gene expression in a time-series experiment is to include means or LS means in the ANOVA spreadsheet.
- Configure the ANOVA dialog to include the factor or interaction of interest
- Select Advanced... from the ANOVA dialog
- Select LS-Mean or Mean
- Use the drop down menus to select the factors or interaction you want the LS mean / mean of
- Select Add for each
- Select OK (Figure 1)
...
- Select OK to close the ANOVA configuration dialog and open the ANOVA spreadsheet
The Sort rows Rows by prototype Prototype function uses every non-text column in a spreadsheet to build and compare patterns; any columns you do not want to include in the pattern similarity analysis need to be removed before running the function.
...
- Select columns you want to remove
- Right-click on a selected column headers
- Select Delete from the pop-up menu
- Select (
 ) from the main command bar to save the modified spreadsheet
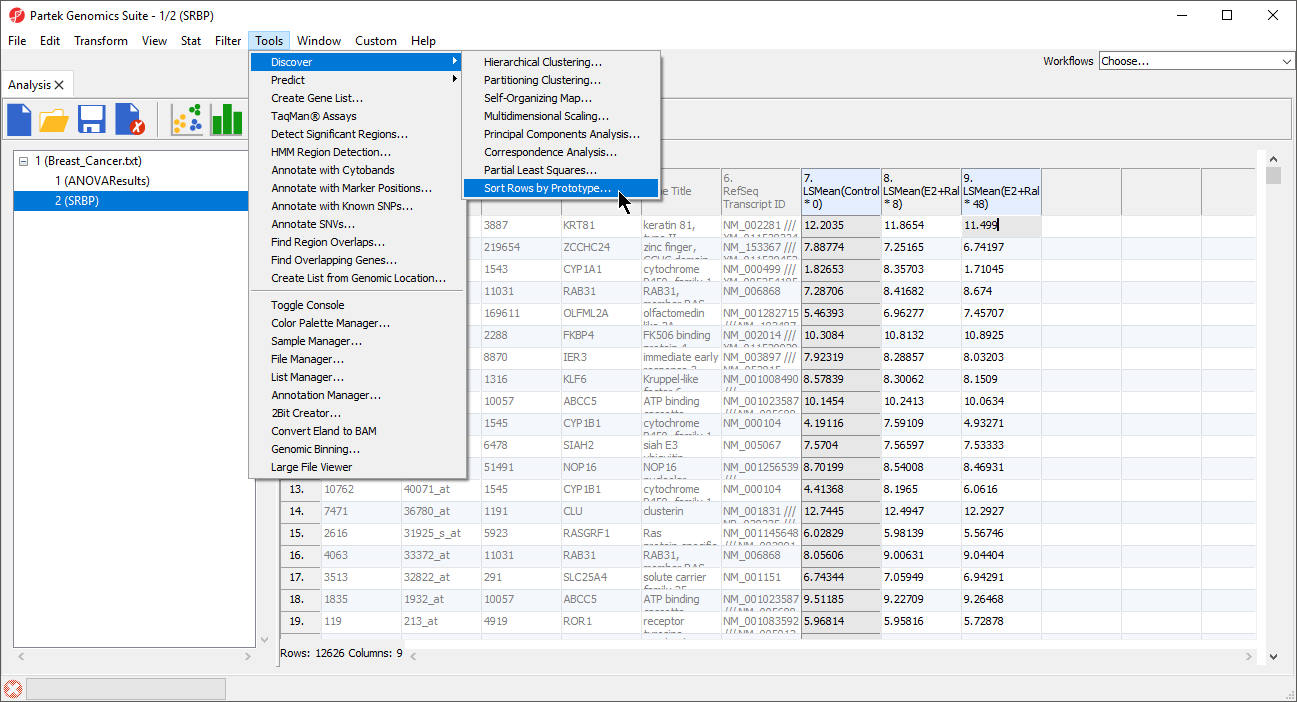
We can now invoke Sort rows Rows by prototype Prototype on the modified spreadsheet.
- Select Tools from the main toolbar
- Select Discovery
- Select Sort Rows by Prototype... (Figure 2)
| Numbered figure captions | ||||
|---|---|---|---|---|
| ||||
|
The Sort Rows by Prototype dialog will launch (Figure 3).
| Numbered figure captions | ||||
|---|---|---|---|---|
|
...
|
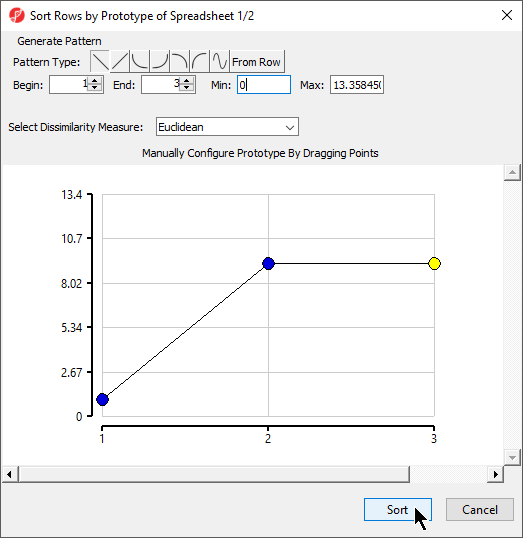
This dialog allows you to configure the pattern, or prototype, that all probe(sets)/genes will be compared to by Sort Rows by Prototype.
...
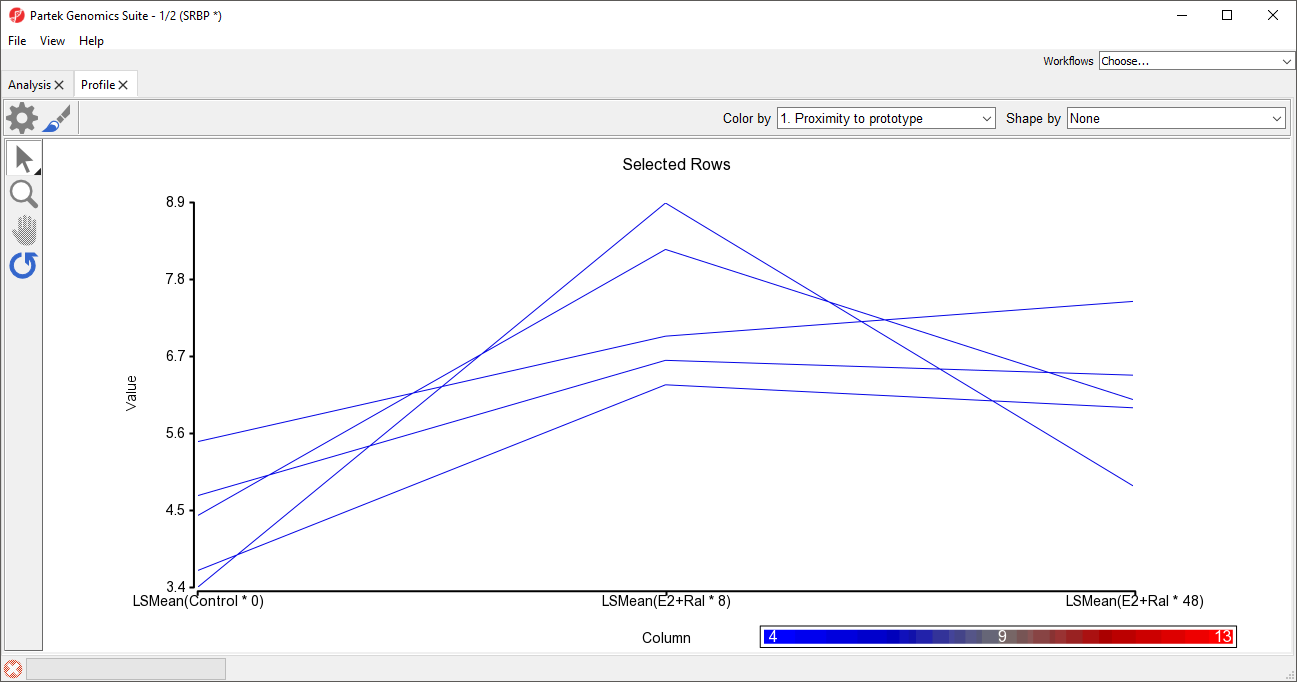
- Select the row headers of the top 5 rows by selecting each while holding the Ctrl key or selecting the first and then fifth while holding the Shift key
- Select View from the main toolbar
- Select Profiles
- Select Row Profiles
- Select Select for both Plots and X-Axis in the Configure Data Source dialog
...
| Numbered figure captions | ||||
|---|---|---|---|---|
| ||||
|
| Page Turner | ||
|---|---|---|
|
| Additional assistance |
|---|
|
| Rate Macro | ||
|---|---|---|
|
Overview
Content Tools