Page History
...
| Numbered figure captions | ||||
|---|---|---|---|---|
| ||||
|
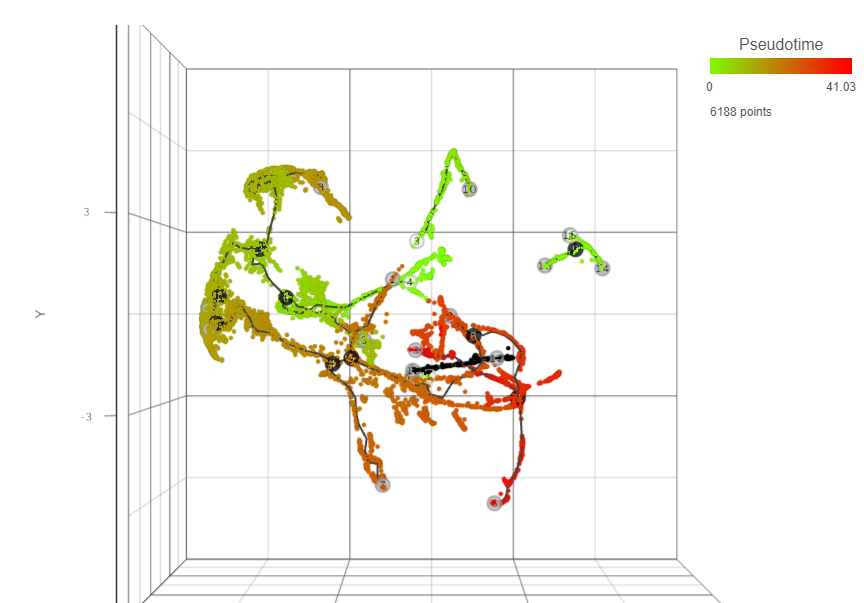
Following pseudotime calculation, three types of cell nodes will be annotated on the plot.Pseudotime calculation display the structure of the graph using black lines. The circles with numbers (cell nodes) on the black lines represent special points. There are three types of cell nodes:
- Root node (white). Root nodes are start points of the pseudotime and were defined by the user in the previous step (e.g. node 4 in Figure 7).
- Branch node (black). Branch nodes indicate where the trajectory tree forks out; i.e. each branch represents a different cell fate or different trajectory (e.g. nodes 3-6, and 8 in Figure 7).
- Leaf (light gray). Leaves correspond to different cell fates / different trajectory outcomes (e.g. nodes 5, 9, and 12 in Figure 7). The leaves correspond to cell states of Monocle 2.
The numbers within the circles are provided for reference purposes only. The intermediate nodes from the previous step have been removed.
...
Overview
Content Tools