Page History
While processing 10x Chromium Single Cell Multiome ATAC + Gene Expression sequencing data via ‘cellranger-arc count’ pipeline, Feature linkages analysis is performed as pairs of genomic features, such as peaks and genes, that have significant correlation in signals across cells. Because it provides a basis for inferring enhancer-gene targeting relationships and constructing transcriptional networks. The features with strong linkages are considered to be “co-expressed” and enriched for a shared regulatory mechanism.
Partek Flow provides the opportunity to our users to explore the linkage relationships among different features including peaks and genes, peaks and peaks, and genes and genes. A tab-delimited file containing information of feature linkages inferred from Flow Cell Ranger - ATAC task will be loaded into Integrative Genome Viewer (IGV)[1] for exploration if Feature linkage analysis task has been completed successfully.
Running Feature linkage analysis
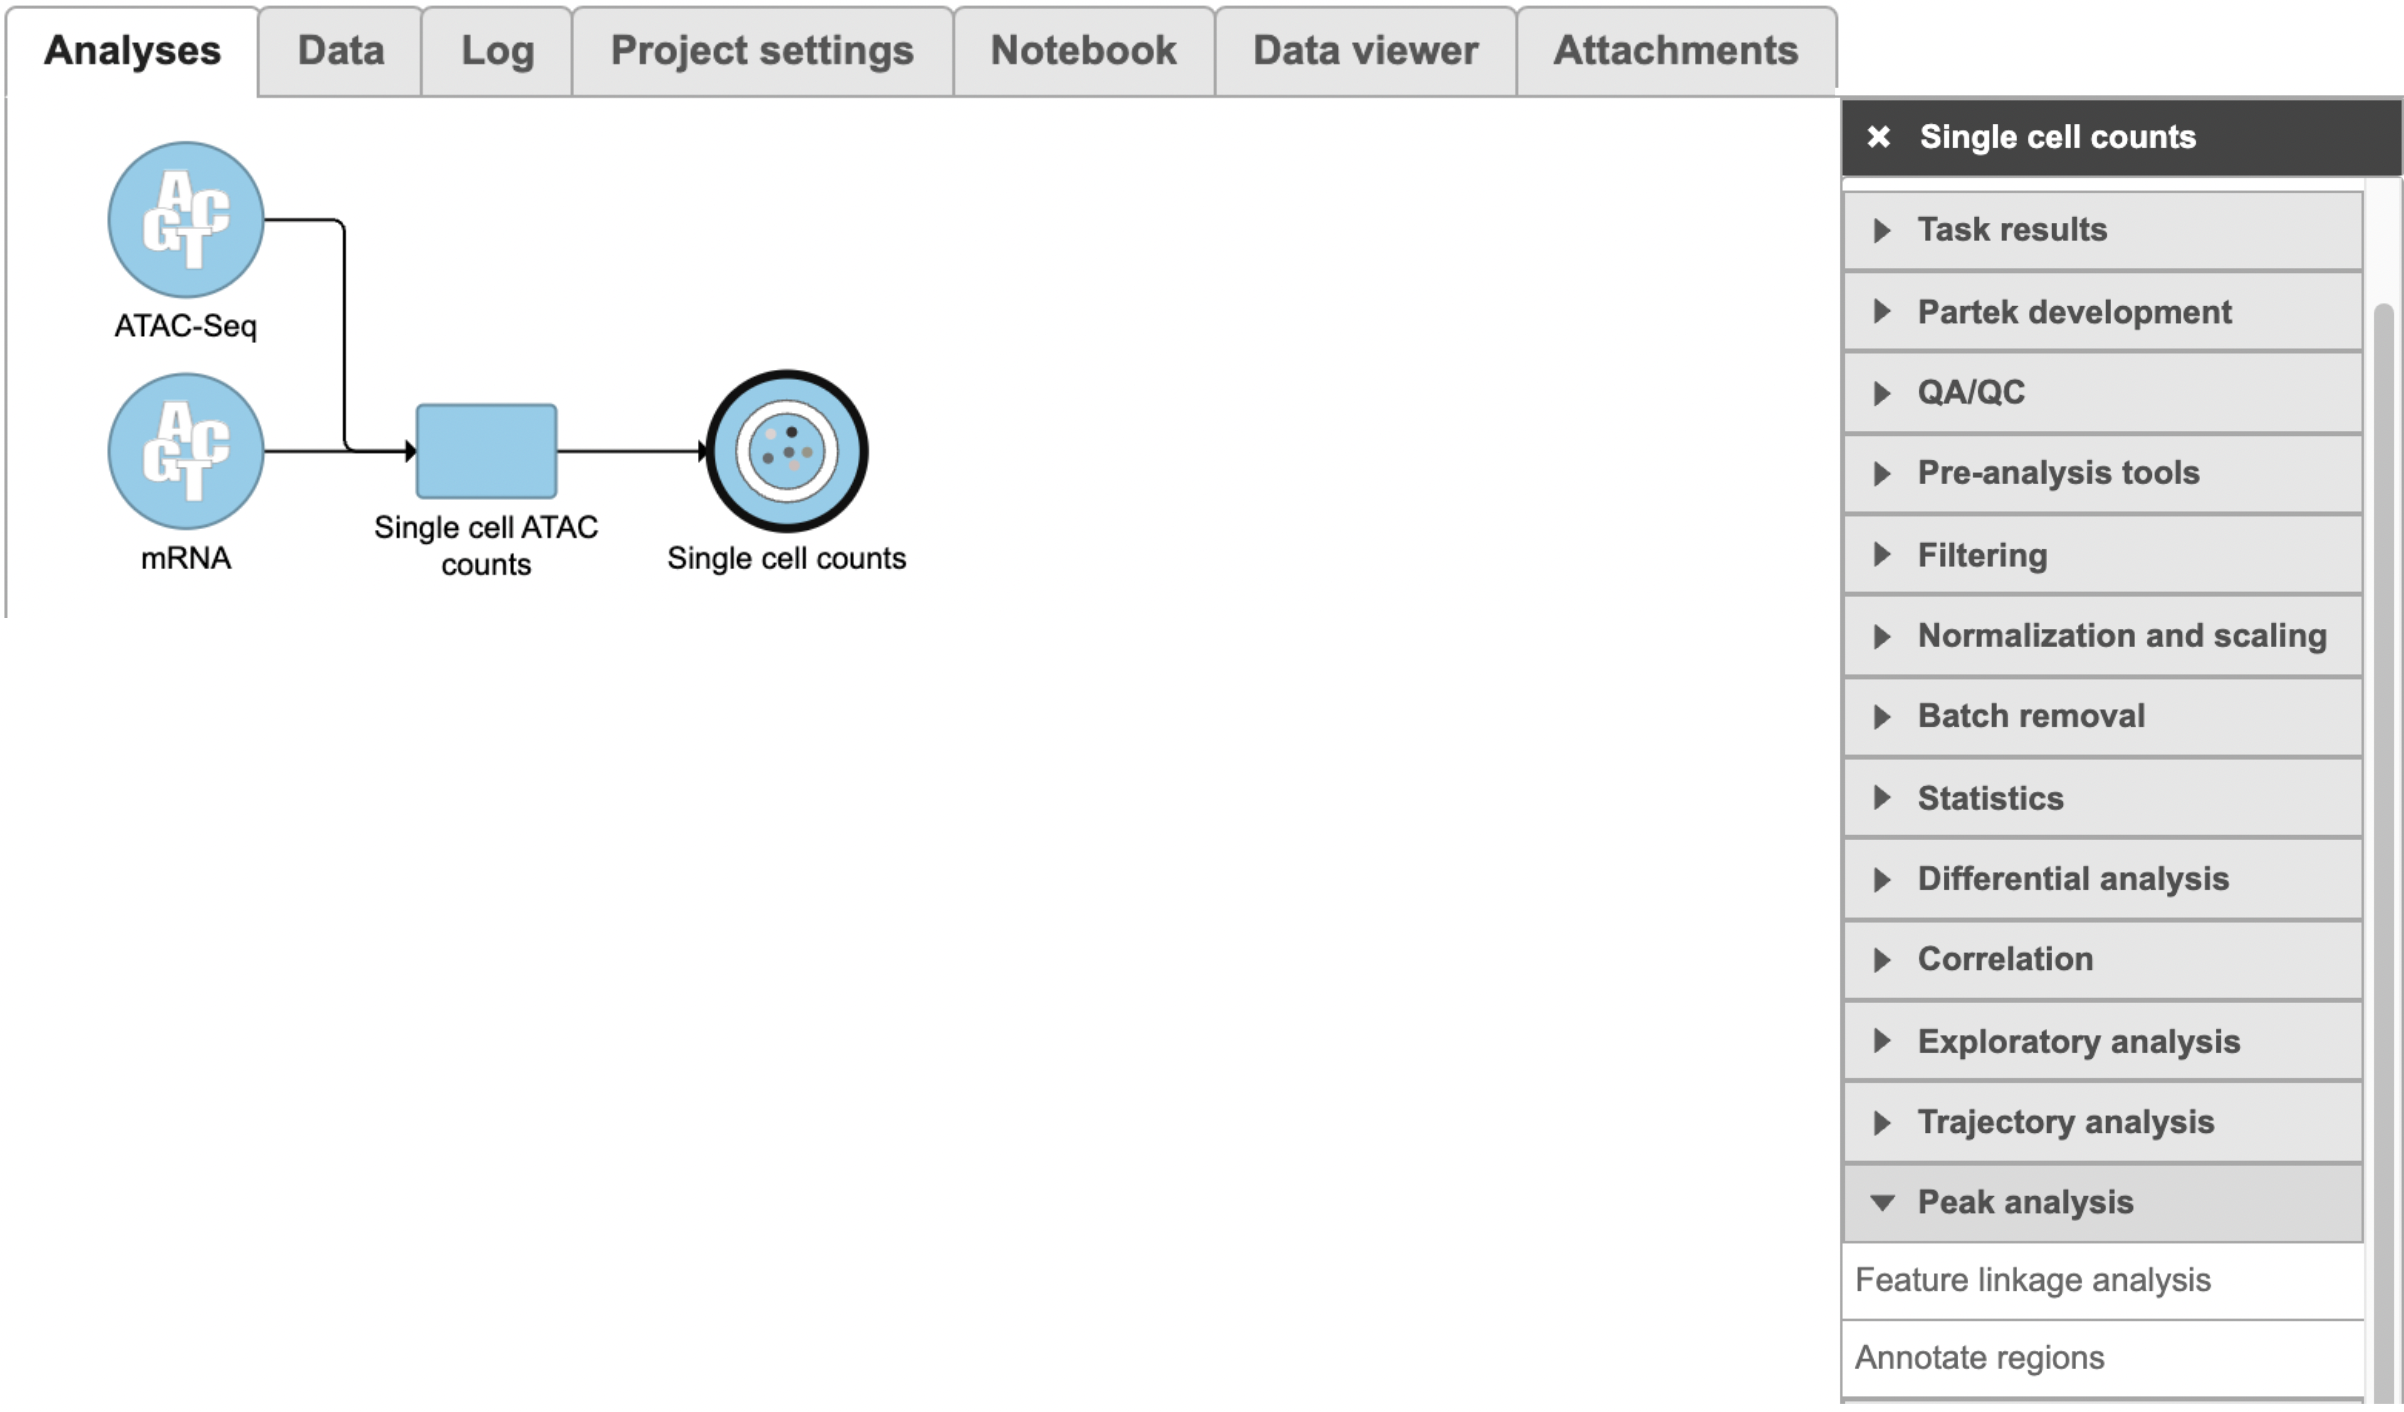
To run Feature linkage analysis task (Figure 1),
- Click one datanode that has both features of ATAC and gene expression;
- Click the Feature linkage analysis task under Peak analysis section in the toolbox;
- Click the Finish button to complete the submission.
| Numbered figure captions | ||||
|---|---|---|---|---|
| ||||
|
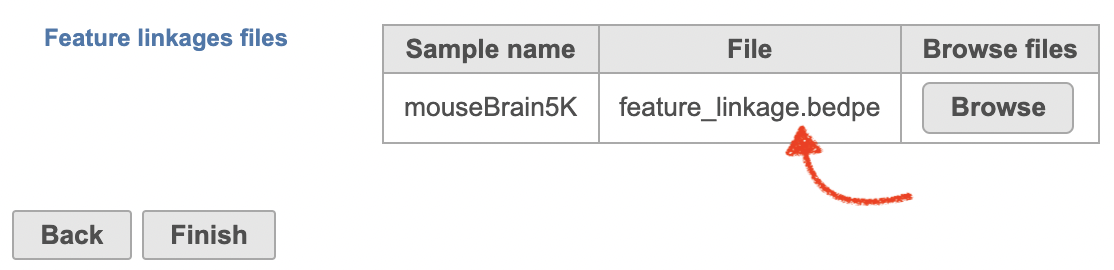
There will be no inputs needed if the FASTQ is converted to counts matrix within Flow. However, if users processed the FASTQ files outside of Partek, and imported the counts matrix into Flow later. The feature_linkage.bedpe file in outs/analysis/feature_linkage from Cell Ranger output will be needed for each sample (Figure 2) to complete the analysis.
| Numbered figure captions | ||||
|---|---|---|---|---|
| ||||
|
Task report
A new datanode will be displayed as the task is finished. Double click on the output datanode, Flow will bring you to the IGV browser when you could explore the “co-expressed”feature pairs (Figure 3).
| Numbered figure captions | ||||
|---|---|---|---|---|
| ||||
|
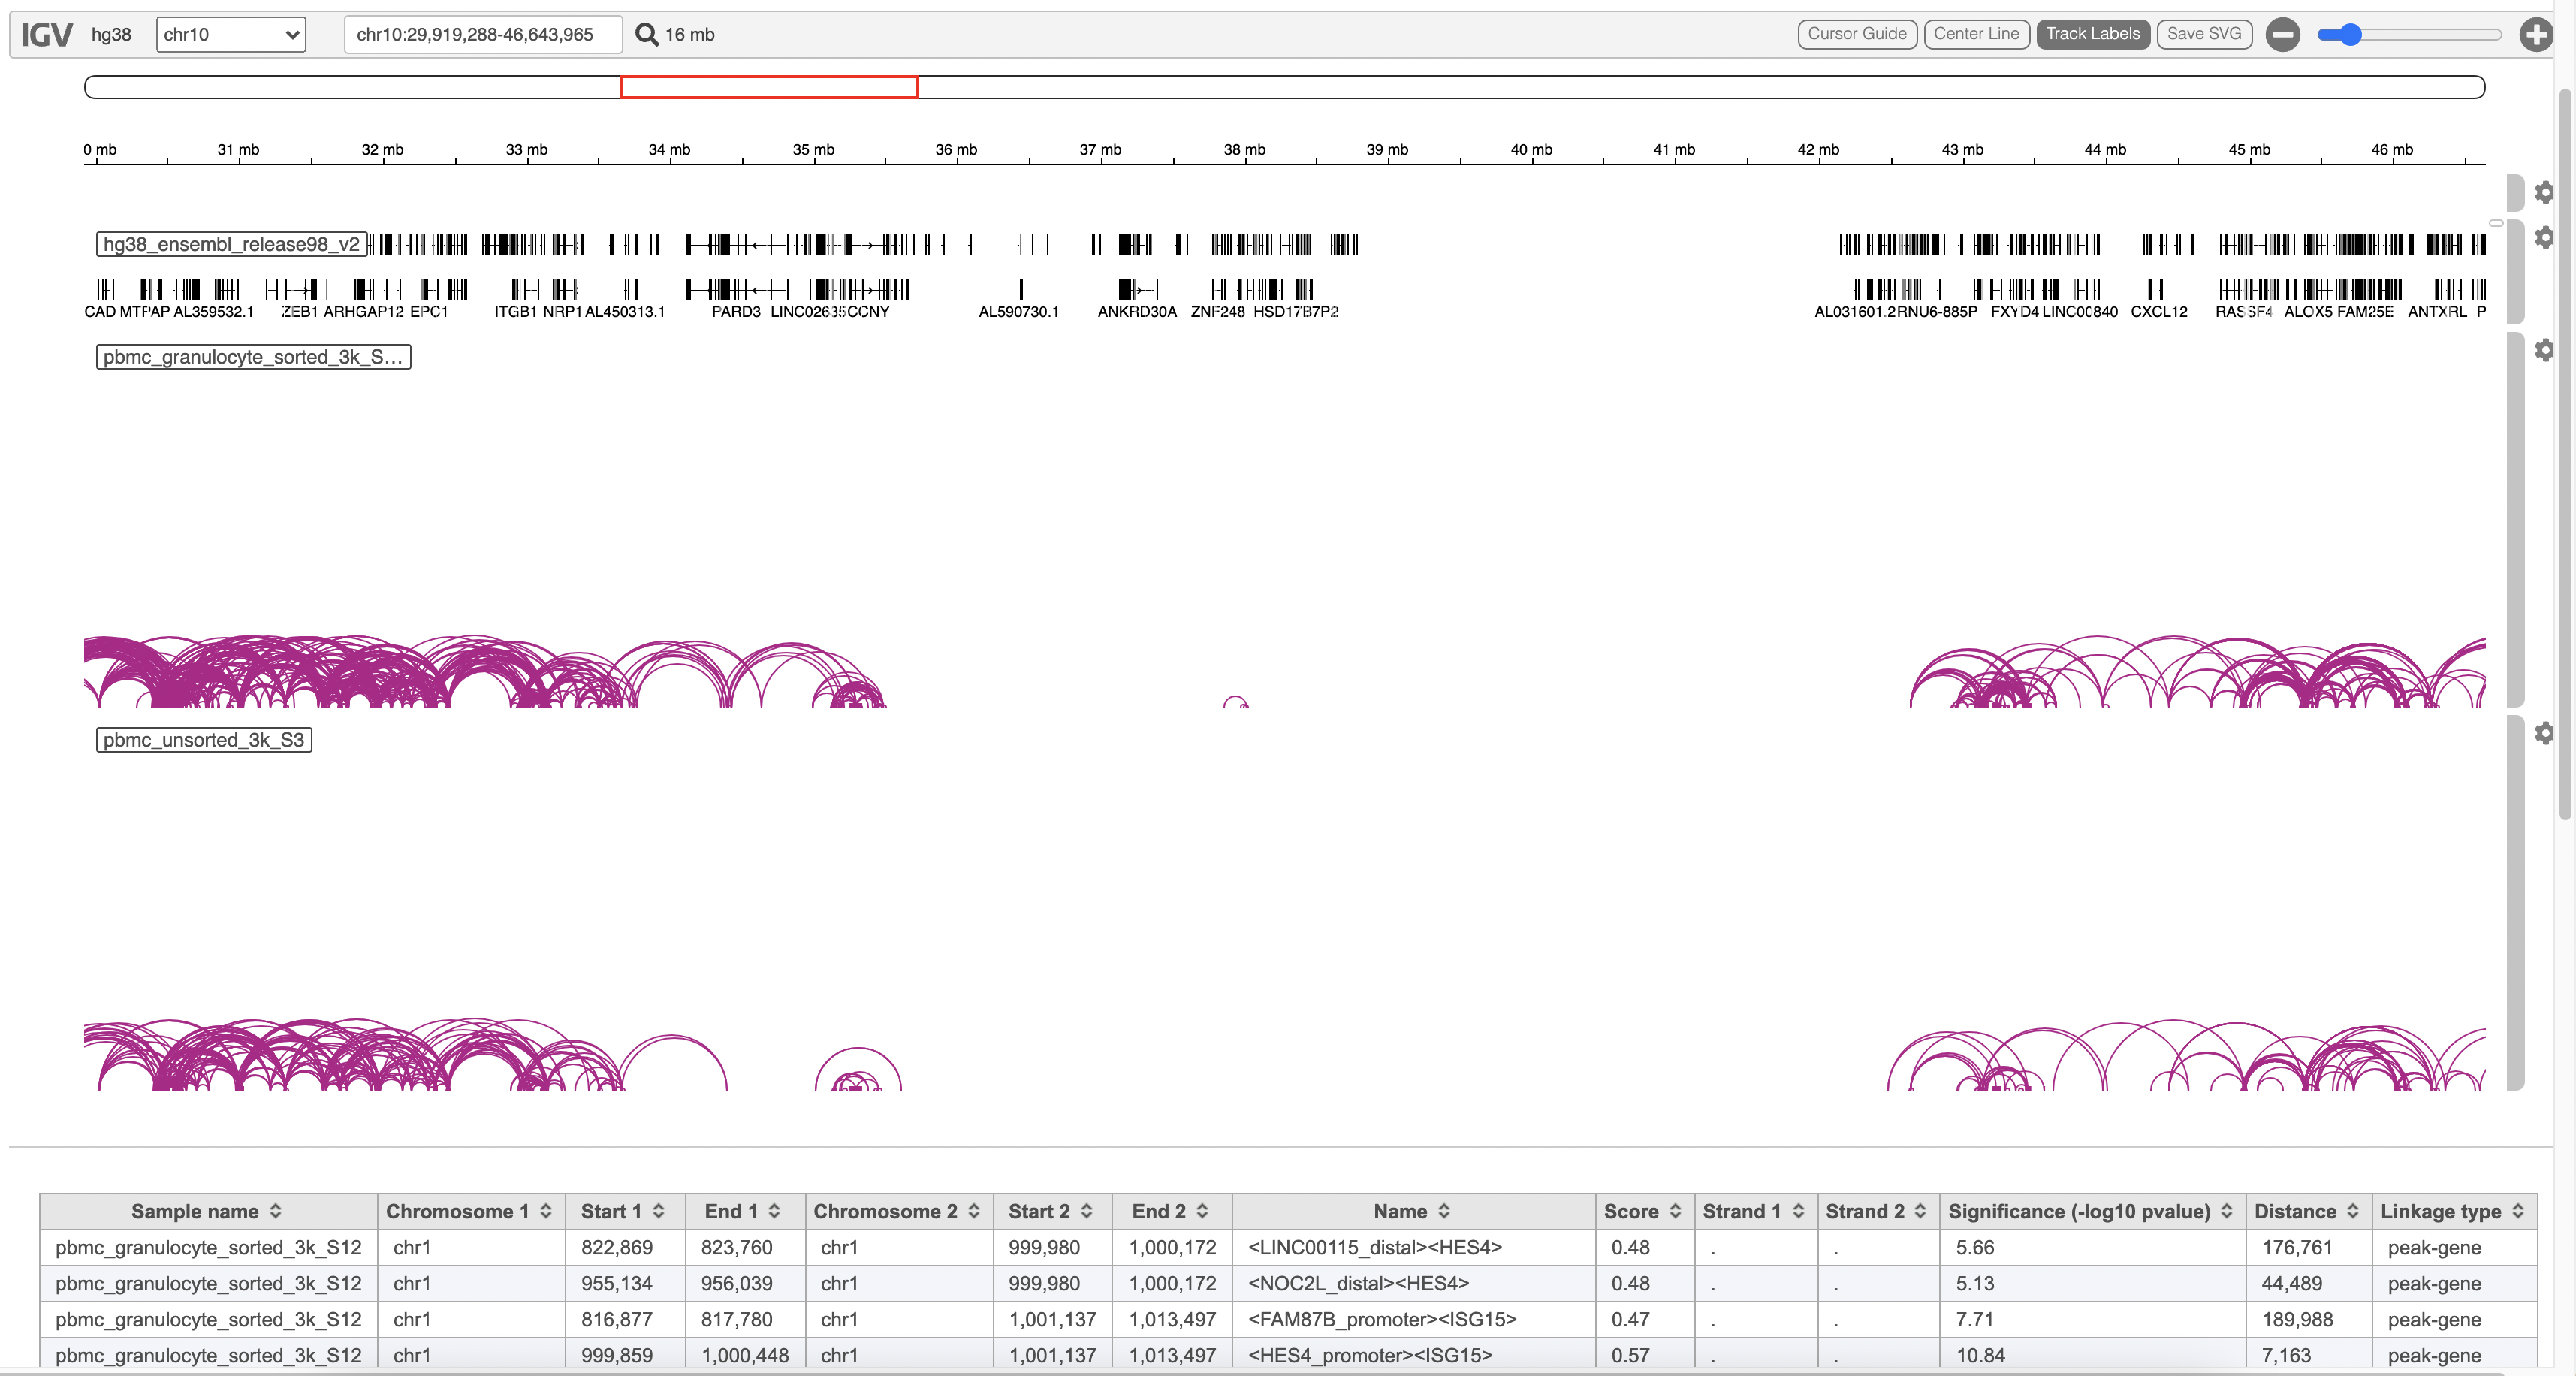
The feature_linkage.bedpe file[2] outputted from Cell Ranger pipeline is available in task report as a table. In the report table, each row is a region of a peak and includes the following information:
- Sample name: name for each sample
- Chromosome 1: the name of the chromosome on which the first end of the feature exists.
- Start 1: the zero-based starting position of the first end of the feature on Chromosome 1.
- End 1: the zero-based ending position of the first end of the feature on Chromosome 1.
- Chromosome 2: the name of the chromosome on which the second end of the feature exists.
- Start 2: the zero-based starting position of the second end of the feature on Chromosome 2.
- End 2: the zero-based ending position of the second end of the feature on Chromosome 2.
- Name: defines the name of the linkage with the format of <name1><name2>, in which name1 and name2 are based on gene symbol or peak annotation.
- Score: linkage correlation, ranging from -1 to 1.
- Strand 1: set to ".".
- Strand 2: set to ".".
- Significance: linkage significance: -log10 (p-value) after multiple testing correction (FDR, false discovery rate). Capped at 299.
- Distance: distance in base pairs from feature 2 to feature 1.
- Linkage type: can be "peak-peak", "gene-peak" or "peak-gene" depending on the type of gene or peak for feature 1 and feature 2.
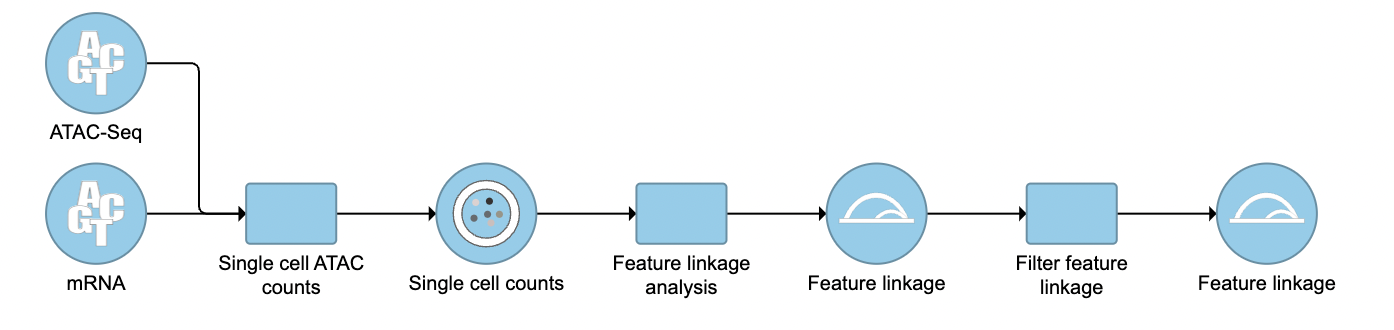
Filter feature linkage task
To filter out and visualize only the linkages that users are interested in is also made possible through the Filter feature linkages task in Flow (Figure 4). Users are able to download the .bedpe file from Flow and explore them via their stand-alone IGV.
| Numbered figure captions | ||||
|---|---|---|---|---|
| ||||
|
References
- https://software.broadinstitute.org/software/igv/
- https://support.10xgenomics.com/single-cell-multiome-atac-gex/software/pipelines/latest/output/analysis
| Additional assistance |
|---|
| Rate Macro | ||
|---|---|---|
|
Overview
Content Tools