Page History
...
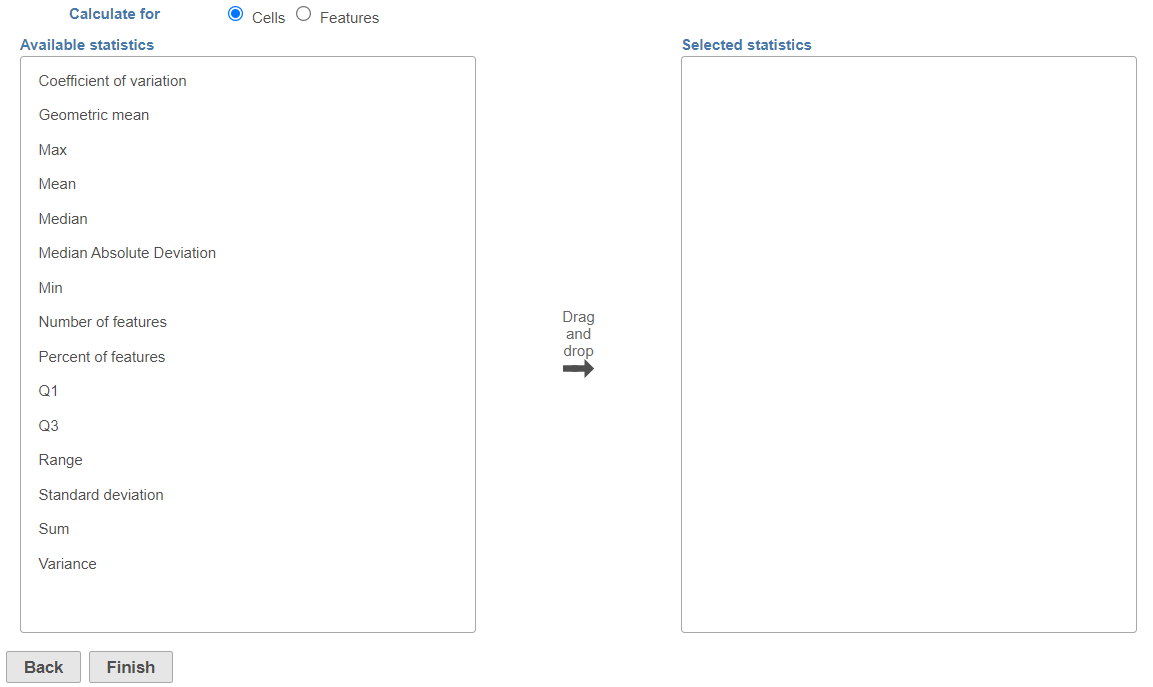
This will invoke the dialog, select the calculation will be performed on cells (or samples for a bulk analysis data node) (Figure 2) or features (Figure 3). Use the Group by option (available for feature-level report) to report the selected statistics per group (e.g. mean and standard deviation per cell type); pick a group from the drop down list and then push the green cross (![]() ) add it. For example, if you are interested in the maximum expression gene expression level across your samples / cells, use the Cells radio button. On the other hand, if you would like to see mean expression of each gene, per cell group, then select the Features radio button and add your cell classification under the Group by drop down.
) add it. For example, if you are interested in the maximum expression gene expression level across your samples / cells, use the Cells radio button. On the other hand, if you would like to see mean expression of each gene, per cell group, then select the Features radio button and add your cell classification under the Group by drop down.
| Numbered figure captions | ||||
|---|---|---|---|---|
| ||||
|
...
- Coefficient of variation (CV):
 s represent the standard deviation
 - Geometric mean: g=

- Max:
- Mean:

- Median: when n is odd, median is
 , when n is even, median is
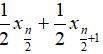
- Median absolute deviation:
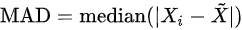 , where
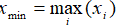
- Min:
- Number of cells: This option reports the absolute number of cells whose
- Percent of cells:
- Number of features:
- Percent of features:
- Non zero percent: percentage of observations that is not zero
...
Overview
Content Tools