Page History
...
| Numbered figure captions | ||||
|---|---|---|---|---|
| ||||
|
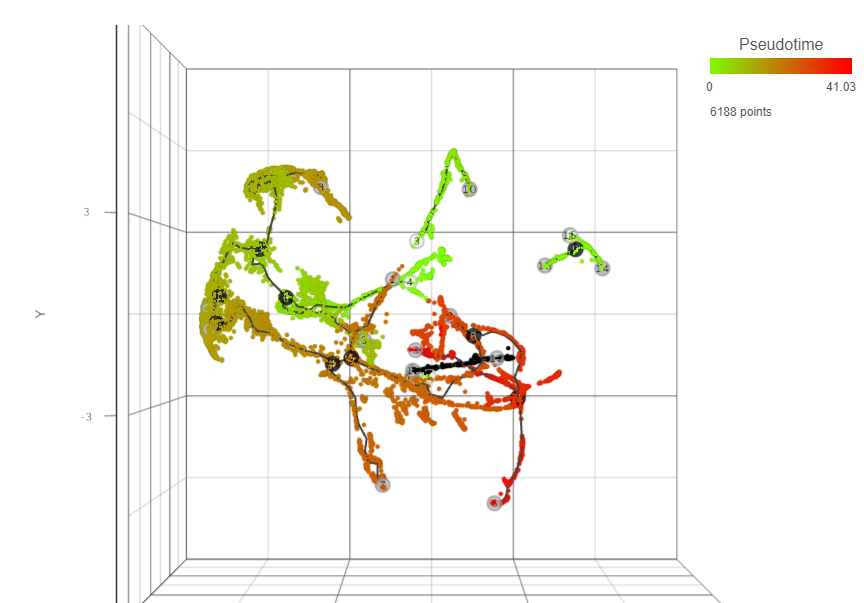
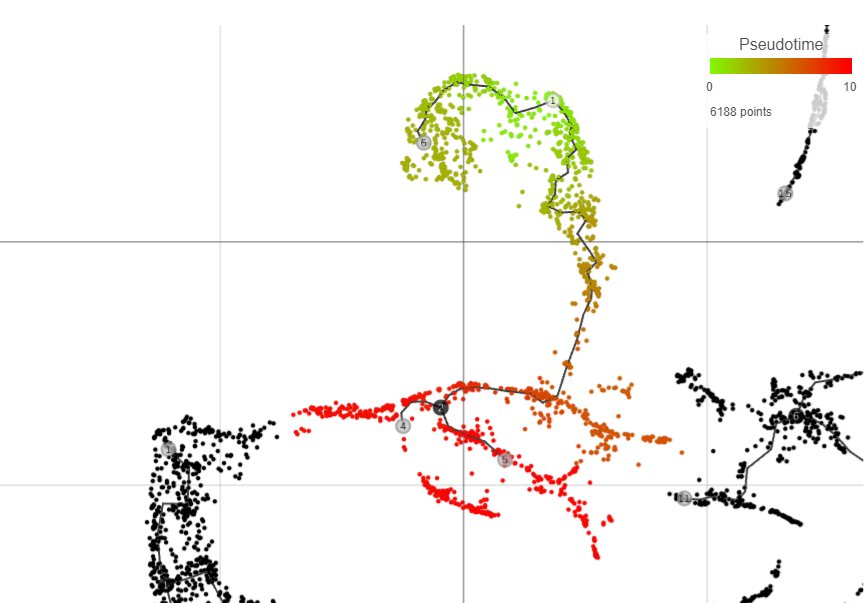
Following pseudotime calculation, three types of cell nodes will be annotated on the plot.
...
| Numbered figure captions | ||||
|---|---|---|---|---|
| ||||
|
References
- Cao J, Spielmann M, Qiu X, Huang X, Ibrahim DM, Hill AJ, Zhang F, Mundlos S, Christiansen L, Steemers FJ, Trapnell C, Shendure J. The single-cell transcriptional landscape of mammalian organogenesis. Nature. 2019 Feb;566(7745):496-502. doi: 10.1038/s41586-019-0969-x. Epub 2019 Feb 20. PMID: 30787437; PMCID: PMC6434952.
...
Overview
Content Tools