Page History
...
- Click a Deduplicated reads data node
- Click the Filtering section of the toolbox
- Click Filter barcodes
Configuring Filter barcodes
You can choose to filter barcodes using three or four options, depending on whether you have already run a Filter barcodes task for your samples in the project (Figure 1).
| Numbered figure captions | ||||
|---|---|---|---|---|
| ||||
|
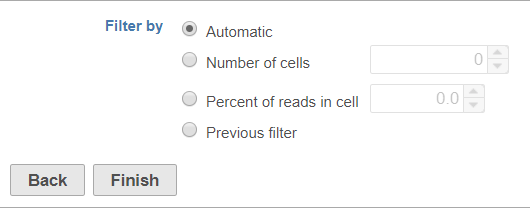
Automatic
The automatic filter threshold is set for each sample individually. It picks the cutoff between cells and empty droplets by identifying where the UMI content per barcode drops precipitously when moving in descending order from the barcode with the highest number of UMIs.
Number of cells
Set the number of cells per sample to include. This is set for all samples; if set to 100, the top 100 barcodes by total UMI count for each sample will be retained.
Percent of reads in cell
Set the percent of reads in cells per sample to include. The number of barcodes included will be set to match the specified percent of reads in cells for each sample. Barcodes are included starting with the barcode with the highest number of total UMIs and proceeding in descending order of total UMIs per barcode until the specified percent of reads has been met or exceeded.
Previous filter
If you have already run a Filter barcodes task for your samples in the project, the Previous filter option will be available. This option lets you filter to the same cell barcodes that were included by the previous filter. This option is particularly useful for CITE-Seq data, where antibody barcodes and gene expression data must be processed separately, but you will want to analyze the same cell barcodes in downstream steps.
Selecting Previous filter opens a table with information about the previous barcode filters in your project (Figure 2).
| Numbered figure captions | ||||
|---|---|---|---|---|
| ||||
|
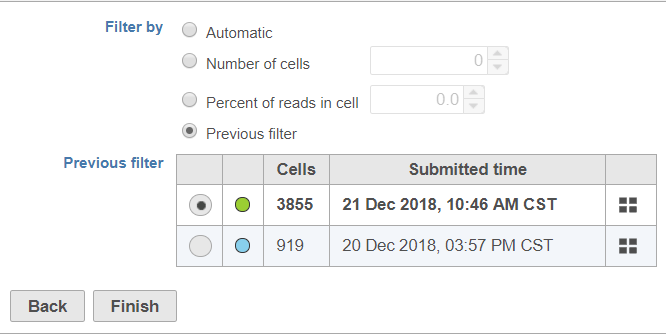
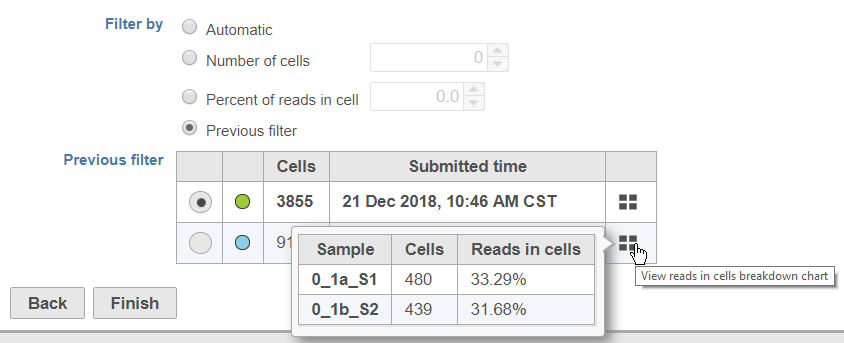
To help you identify which previous filter you want to apply, the color of the task node on the Analyses tab, the number of cell barcodes retained (summed for all samples), and the time/date the previous filter task was submitted are included in the table. To view the number of cells and percentage of reads in cells for each sample in a previous filter, mouse over the  button (Figure 3).
| Numbered figure captions | ||||
|---|---|---|---|---|
| ||||
|
Use the radio buttons in the first column to pick which filter you want to use.
Output of Filter barcodes
After configuring the task, click Finish to run.
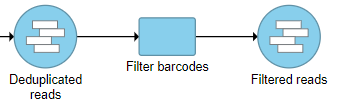
Filter barcodes produces a Filtered reads data node (Figure 4). Filter barcodes does not have a task report.
| Numbered figure captions | ||||
|---|---|---|---|---|
| ||||
|
...
| Additional assistance |
|---|
| Rate Macro | ||
|---|---|---|
|
...
Overview
Content Tools