Page History
...
| Numbered figure captions | ||||
|---|---|---|---|---|
| ||||
|
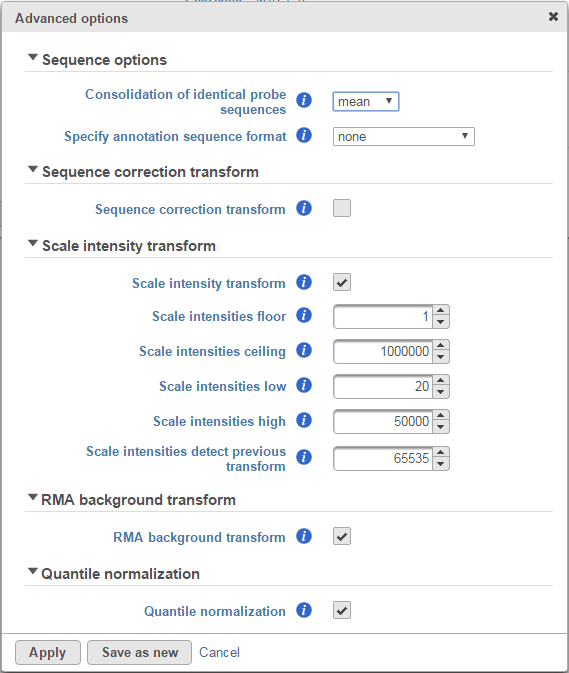
The Specify annotation sequence format drop-down menu allows you to specify the format of the probe sequences associated with your microarrays. Please consult with the manufacturer of your microarrays to determine the exact specification of their probe annotation files. The options available for sequence annotation include:
...
| Numbered figure captions | ||||
|---|---|---|---|---|
| ||||
|
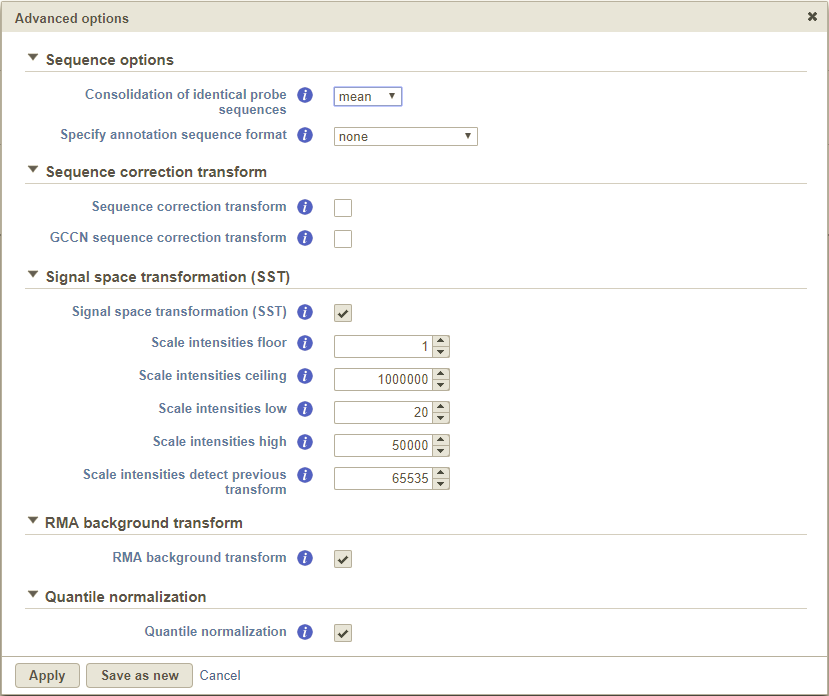
The Clicking the Sequence correction transform checkbox corrects intensity values for sequence-specific effects. It is turned off by default and we only advise that you select this option if there are wide differences in the GC content of your probes.
Selecting the GCCN sequence correction transform checkbox normalizes the intensities with respect to the difference in probe affinity associated with Guanine and Cytosine (GC) contentv [1].
The Scale intensity transform was developed by Affymetrix to improve inter-platform comparisons between microarray and RNA-seq data. Specifically, the algorithm stretches the intensity distribution to a common range with a power law mapping that decompresses fold change ratios [1]. This ultimately simplifies fold change comparisons between different technologies.
...
References
- Affymetrix Whitepaper on Microarray normalization using Signal Space Transformation with probe Guanine Cytosine Count Correction. Accessed February 17, 2016
- Irrizarry RA, Hobbs B, Collin F et al. Exploration, normalization, and summaries of high density oligonucleotide array probe level data. Biostat. 2003; 4:249-264.
...
Overview
Content Tools