Join us for a webinar: The complexities of spatial multiomics unraveled
May 2
Page History
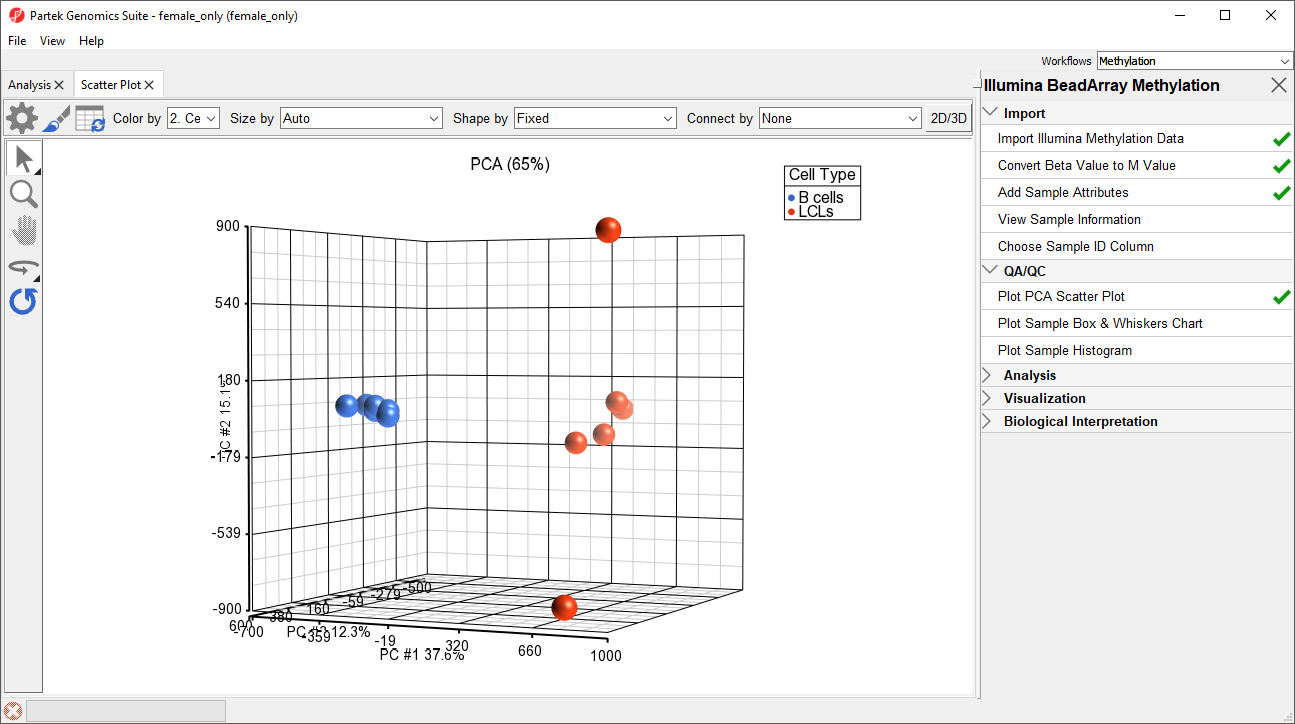
Principal component analysis (PCA) can be performed to visualize clusters in the methylation data, but also serves as a quality control procedure; outliers within a group could suggest poor data quality, batch effects, mislabeled samples, or uninformative groupings.
- Select female_only in the spreadsheet tree
- Select Plot PCA Scatter Plot from the QA/QC section of the Illumina BeadArray Methylation workflow to bring up a Scatter Plot tab
- Select 2. Experimental Group for Color by
- Select (
 ) to enable Rotate Mode
 - Left click and drag to rotate the plot and view different angles (Figure 1)
...
| Numbered figure captions | ||||
|---|---|---|---|---|
| ||||
|

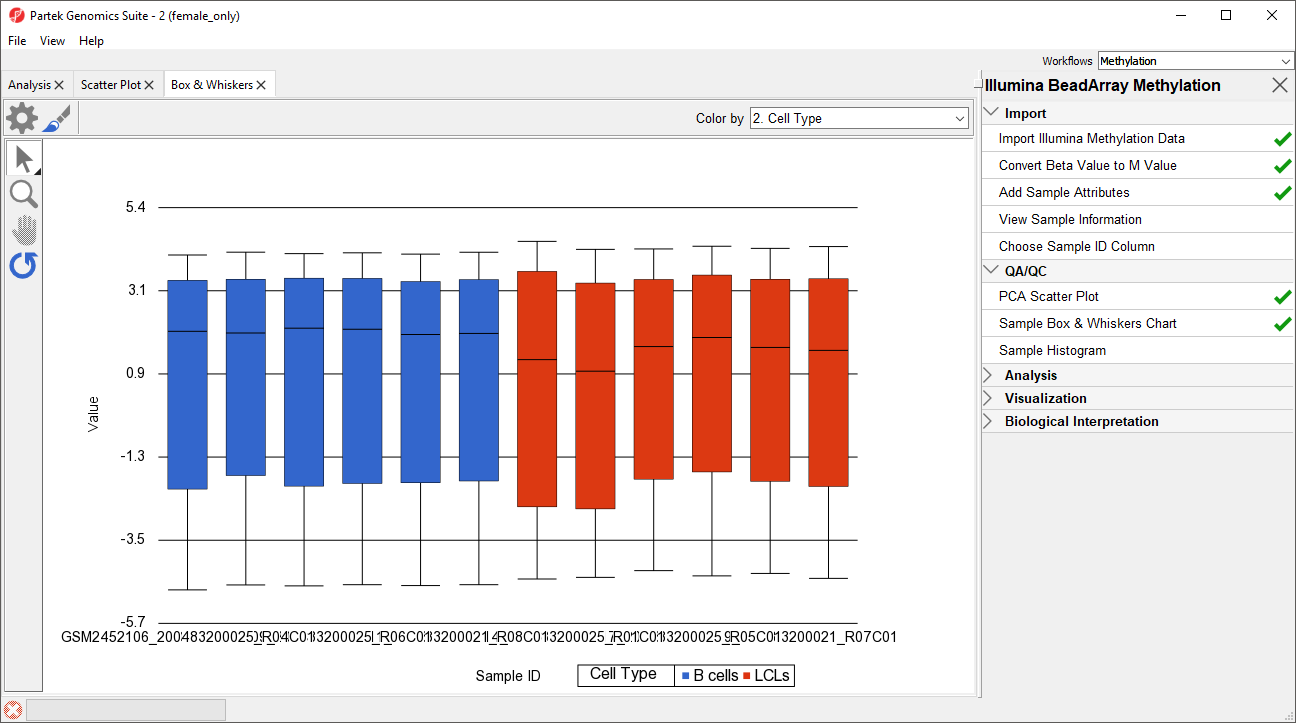
Next, distribution of M-values across the samples can also be inspected by a box-and-whiskers plot.
...
| Numbered figure captions | ||||
|---|---|---|---|---|
| ||||
|

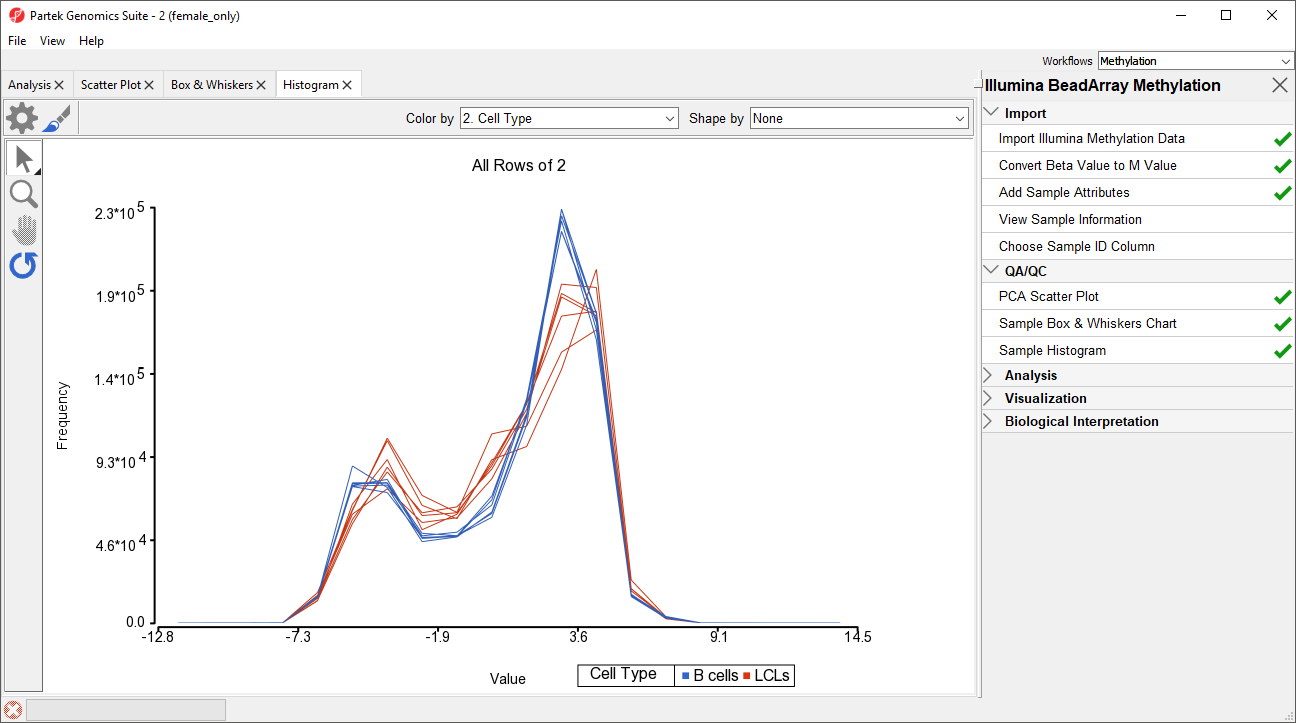
An alternative way to take a look at the distribution of M-values is a histogram.
...
| Numbered figure captions | ||||
|---|---|---|---|---|
| ||||
|

| Page Turner | ||
|---|---|---|
|
...
Overview
Content Tools