Page History
| Table of Contents | ||||||
|---|---|---|---|---|---|---|
|
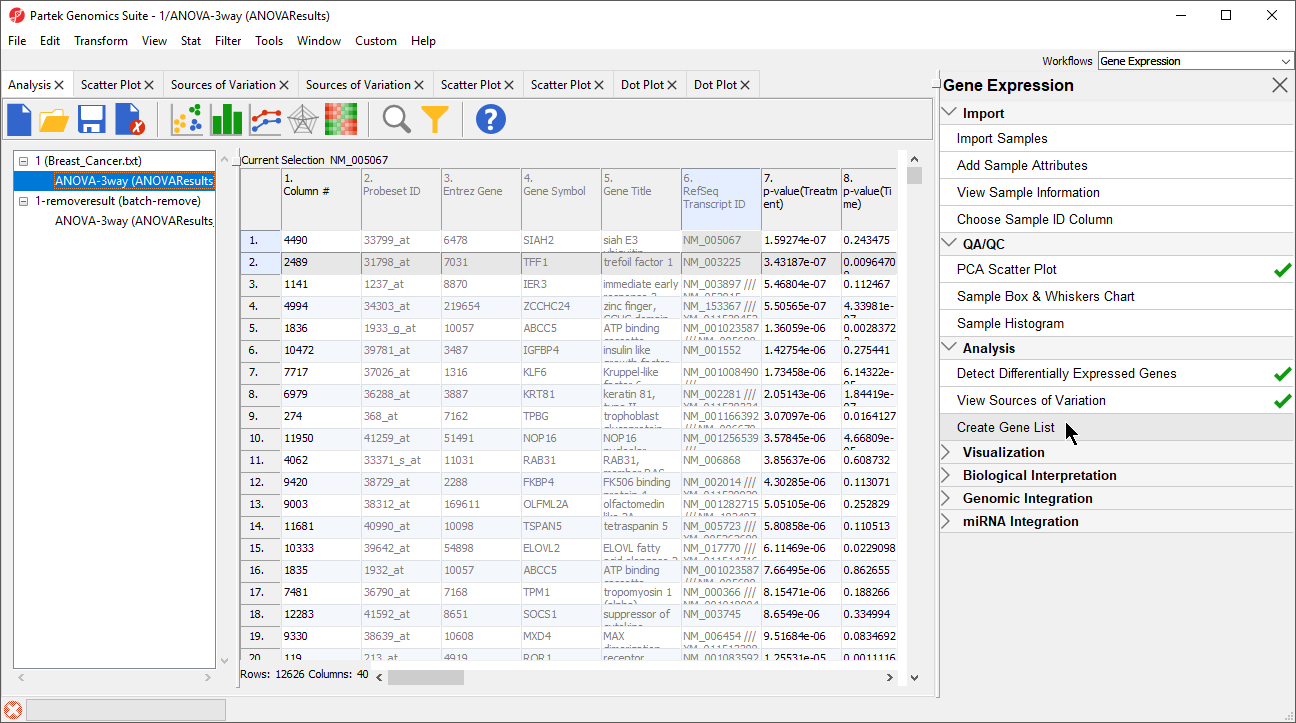
The List Manager can be used to generate lists of genes by applying criteria such as fold change and false discovery rate (FDR) adjusted p-value thresholds.
- Select the Analysis tab
- Select ANOVAResults in the spreadsheet tree
- Select Create Gene List from the Analysis section of the Gene Expression workflow (Figure 1)
| Numbered figure captions | ||||
|---|---|---|---|---|
| ||||
|
- Select E2 vs. Control from the Contrast panel of the ANOVA Streamlined tab in the List Manager dialog
- Deselect the Include size of the change option
- Set p-value with FDR < to 0.1 (Figure 2)
| Numbered figure captions | ||||
|---|---|---|---|---|
| ||||
|
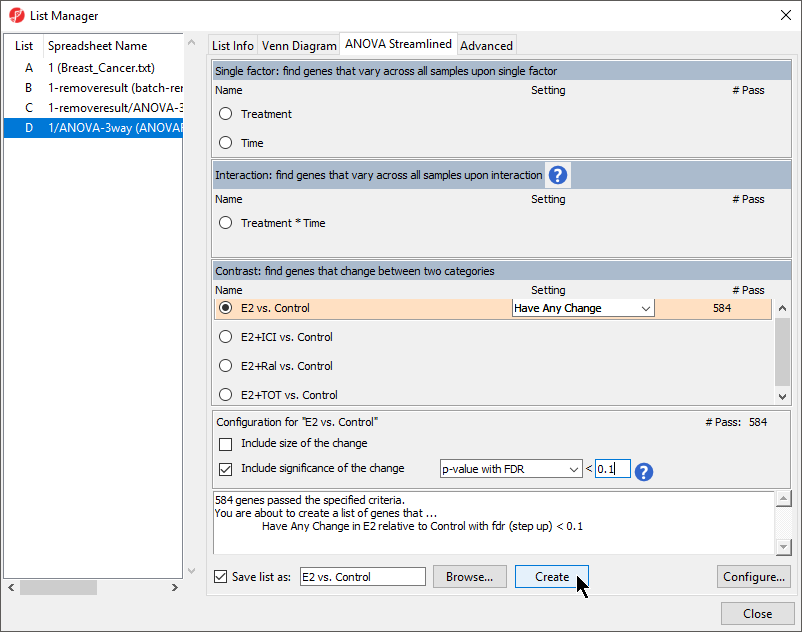
There should be ~545 probe(sets)/genes that meet this threshold.
- Select Create
A new spreadsheet, E2 vs. Control will be added as a child spreadsheet of Breast_Cancer.txt.
- Repeat the steps listed above to create lists for E2+ICI vs. Control (~24 genes),E2+Ral vs. Control (~22 genes), and E2+TOT vs. Control (~177 genes) with the same threashold
Now we can use the Venn Diagram to create a list of genes that are differentially regulated in all treatment groups.
- Select the Venn Diagram
The Venn Diagram shows the amount of overlap between all selected gene lists.
- Select the four created lists (E-H) in the spreadsheet list
The Venn Diagram will display the number of overlapping and distinct genes from four lists (Figure 3).
| Numbered figure captions | ||||
|---|---|---|---|---|
| ||||
|
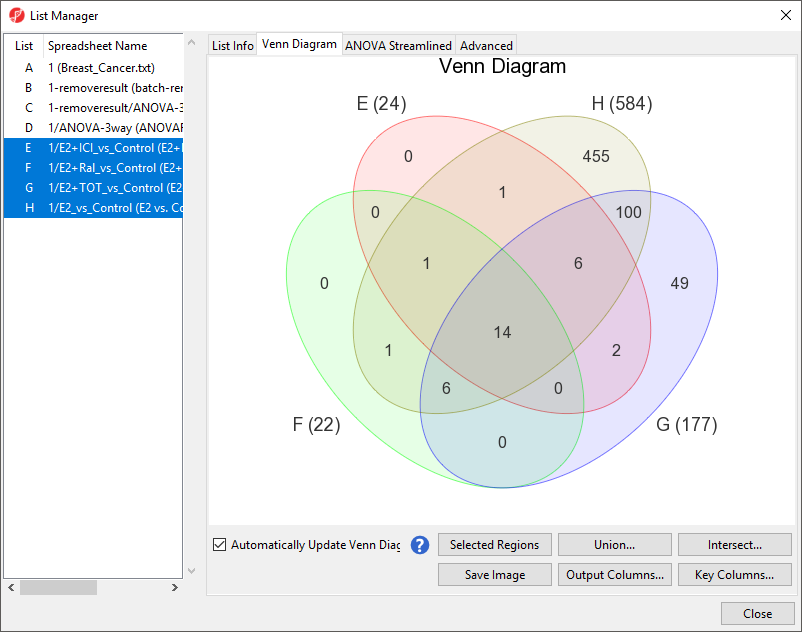
The intersection of the four ellipses shows that 14 genes are in common between the four threatment schemes.
- Select the region intersecting all four ellipses
- Right-click
- Select Create List From Highlighted Regions
- Select Close to exit the List Manager dialog
The new list will appear in the spreadsheet tree with a temporary file name (ptpm).
- Select the temporary list in the spreadsheet tree
- Select (
 ) from the command bar
 - Save the list as fourtreatments
| Page Turner | ||
|---|---|---|
|
| Additional assistance |
|---|
|
| Rate Macro | ||
|---|---|---|
|
Overview
Content Tools