Join us for a webinar: The complexities of spatial multiomics unraveled
May 2

PGS Documentation

Page tree

Versions Compared

Key

  • This line was added.
  • This line was removed.
  • Formatting was changed.

...

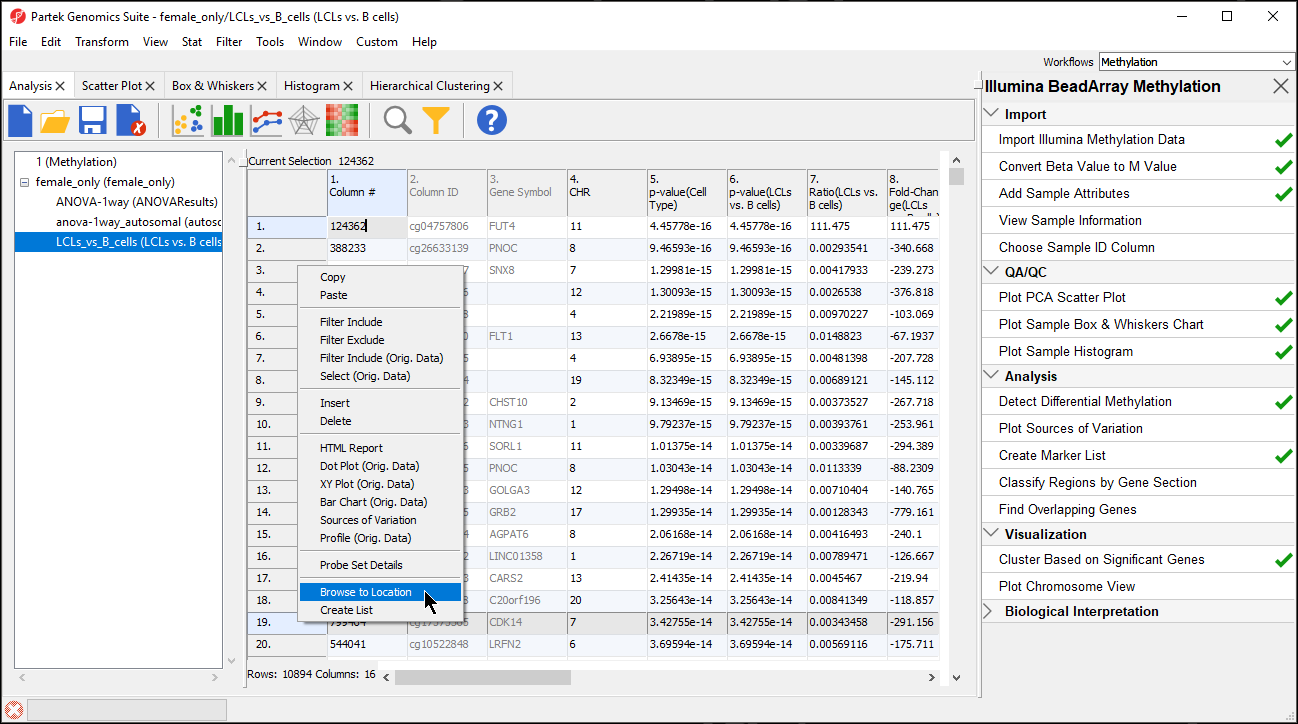
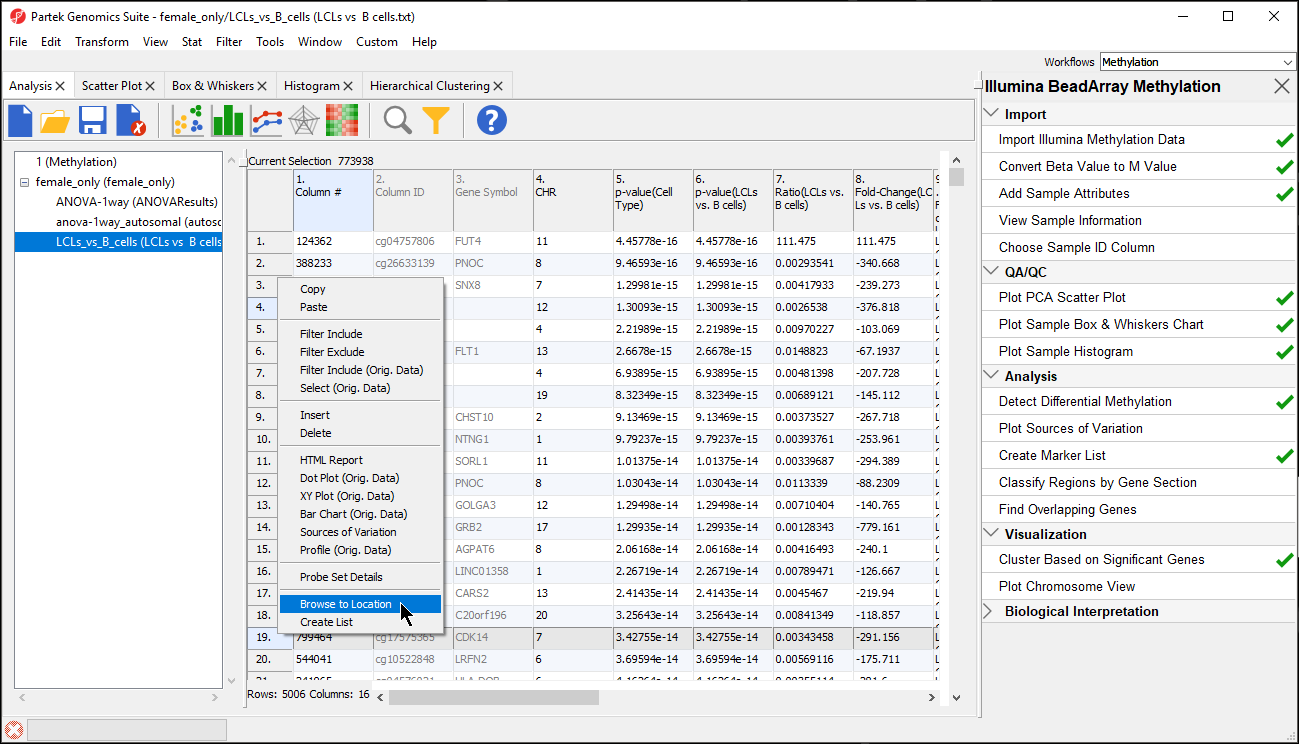
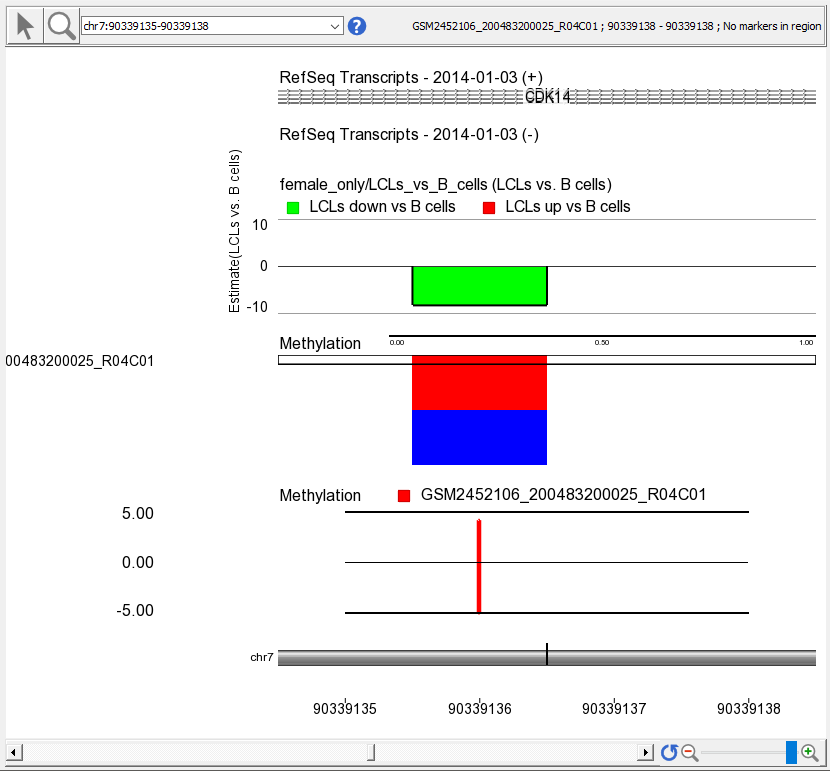
  • Right click row 19. Cdk14 in the LCLs vs . B cells spreadsheet
  • Select Browse to Location from the pop-up menu

Numbered figure captions
SubtitleTextBrowsing to location from spreadsheet with differentially expressed genes
AnchorNameBrowsing to Location

Image RemovedImage Added

The Genome Viewer tab will open, zoomed in to the selected CpG locus in CDK14 (Figure 2). 


Numbered figure captions
SubtitleTextViewing location in Genome Viewer
AnchorNameView at Location

Image RemovedImage Added

The Genome Viewer visualization is composed of a series of tracks corresponding to annotation files and data files. 

...

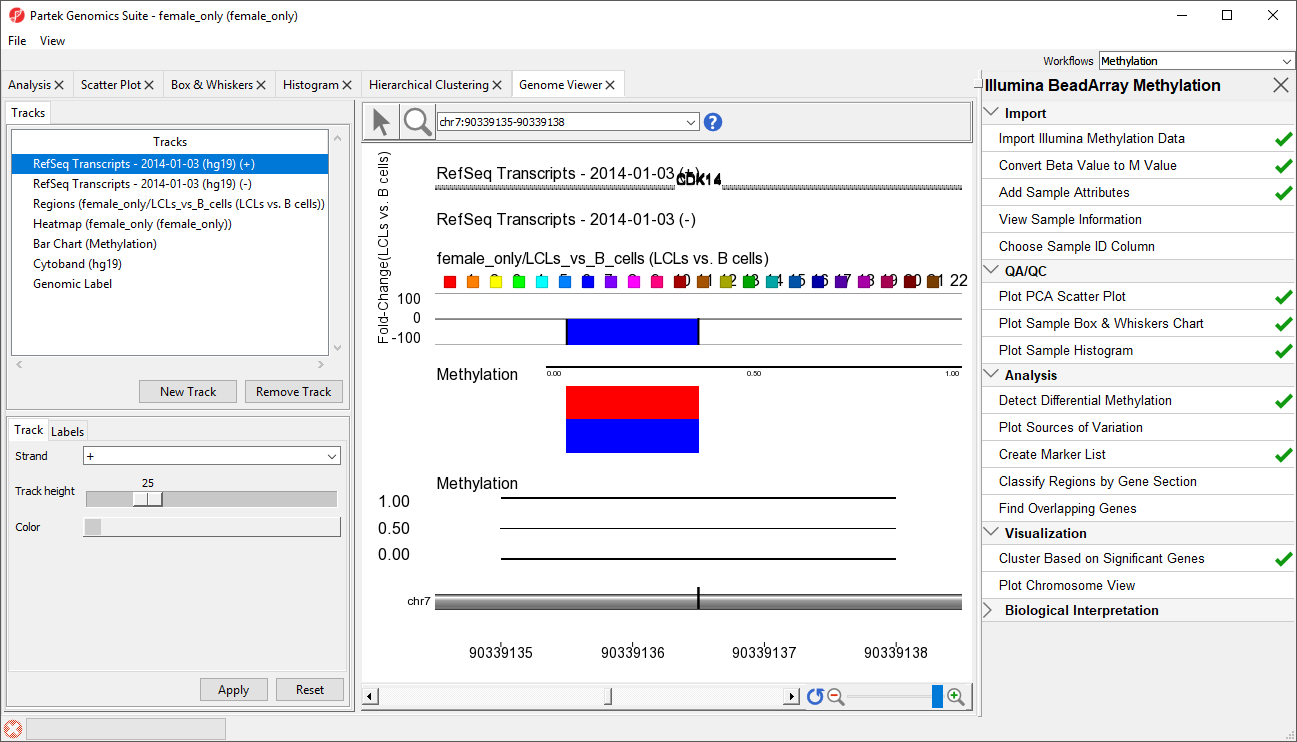
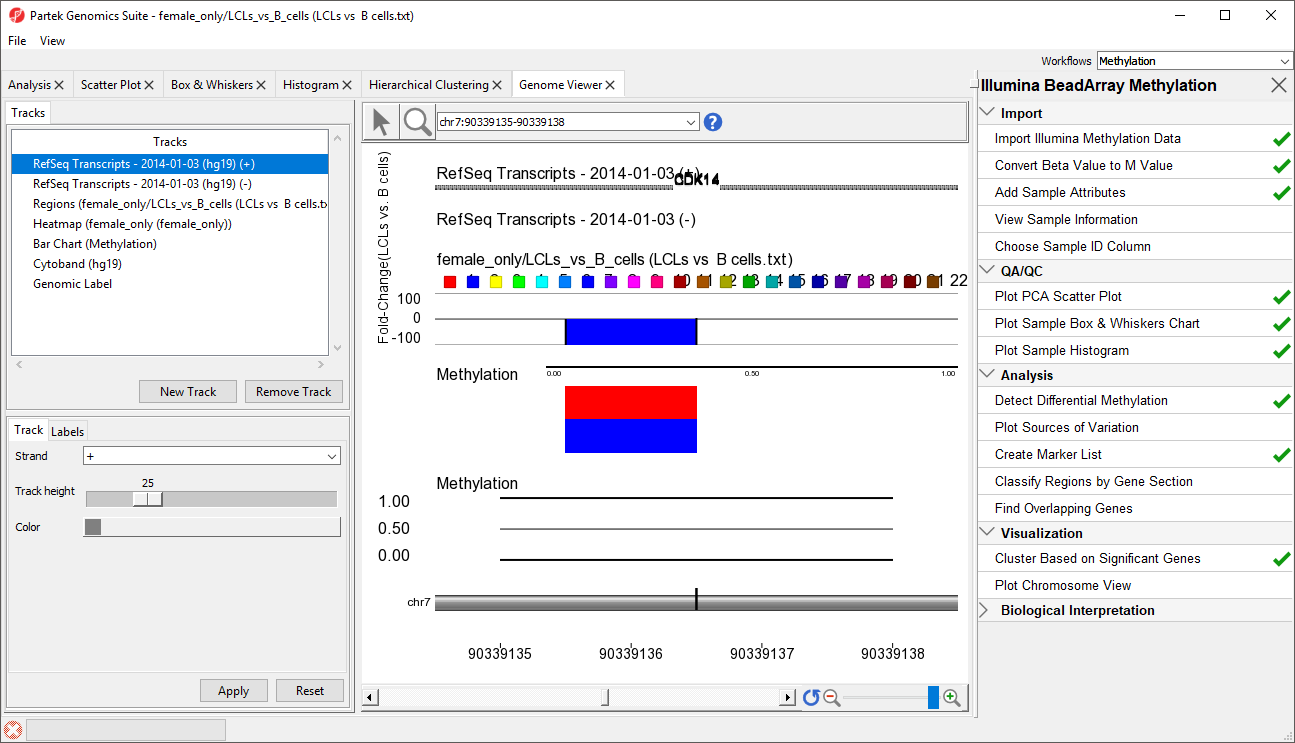
A bar indicating the M value at this probe set will appear in the Bar Chart track (Figure 3). 


Numbered figure captions
SubtitleTextModify the tracks of the Genome Viewer to facilitate visual analysis
AnchorNameModified Genome Viewer

...