| Table of Contents |
|---|
| maxLevel | 2 |
|---|
| minLevel | 2 |
|---|
| exclude | Additional Assistance |
|---|
|
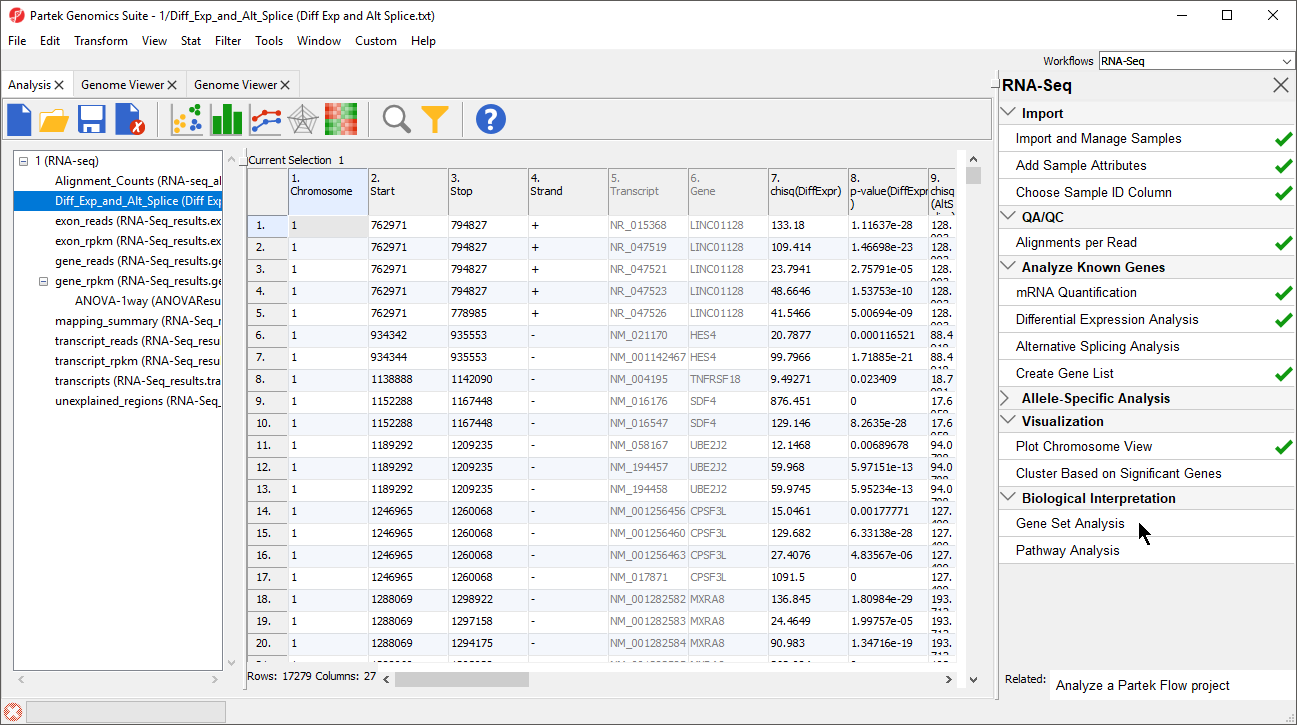
With the GO Enrichment feature in Partek Genomics Suite, you can take a list of significantly expressed genes/transcripts and find GO terms that are significantly enriched within the list. For a detailed introduction to GO Enrichment, refer to the GO Enrichment User Guide (Help > On-line Tutorials > User Guides).
- Select Gene Set Analysis in the Biological Interpretation section of the RNA-Seq workflow (Figure 1)
| Numbered figure captions |
|---|
| SubtitleText | Selecting Gene Set Analysis |
|---|
| AnchorName | Selecting Gene Set Analysis |
|---|
|
|
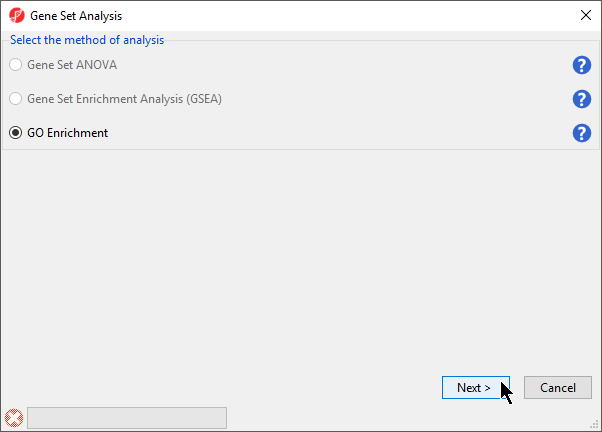
- Select GO Enrichment in the Gene Set Analysis dialog (Figure 2)
- Select Next >
| Numbered figure captions |
|---|
| SubtitleText | Selecting the method of analysis |
|---|
| AnchorName | Gene Set Analysis dialog |
|---|
|
|
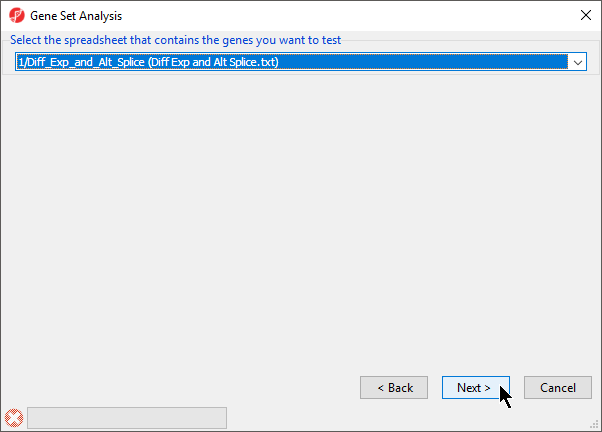
- Select the spreadsheet 1/Diff_Exp_and_Alt_Splice (Diff Exp and Alt Splice.txt) from the drop-down menu (Figure 3)
- Select Next >
| Numbered figure captions |
|---|
| SubtitleText | Selecting the spreadsheet that contains the genes you want to test |
|---|
| AnchorName | Choosing Spreadsheet |
|---|
|
|
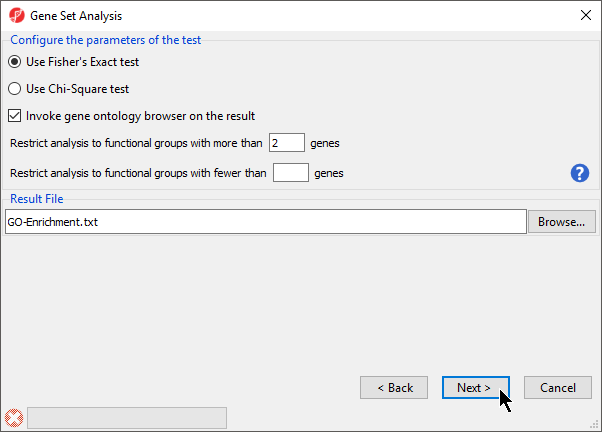
- Select Use Fisher's Exact test
- Select Invoke gene ontology browser on the result
- Set Restrict analysis to functional groups with more than _ genes to 2 (Figure 4)
- Select Next >
| Numbered figure captions |
|---|
| SubtitleText | GO Enrichment options |
|---|
| AnchorName | Selecting Gene Set Analysis conditions |
|---|
|
|
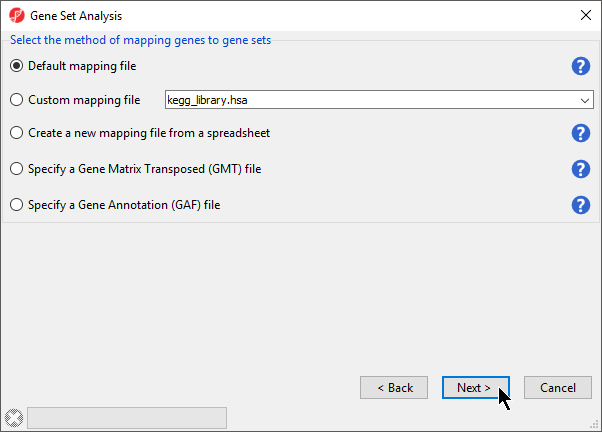
- Select Default mapping file (Figure 5)
- Select Next >
| Numbered figure captions |
|---|
| SubtitleText | Selecting the mapping file |
|---|
| AnchorName | Selecting Mapping File |
|---|
|
|
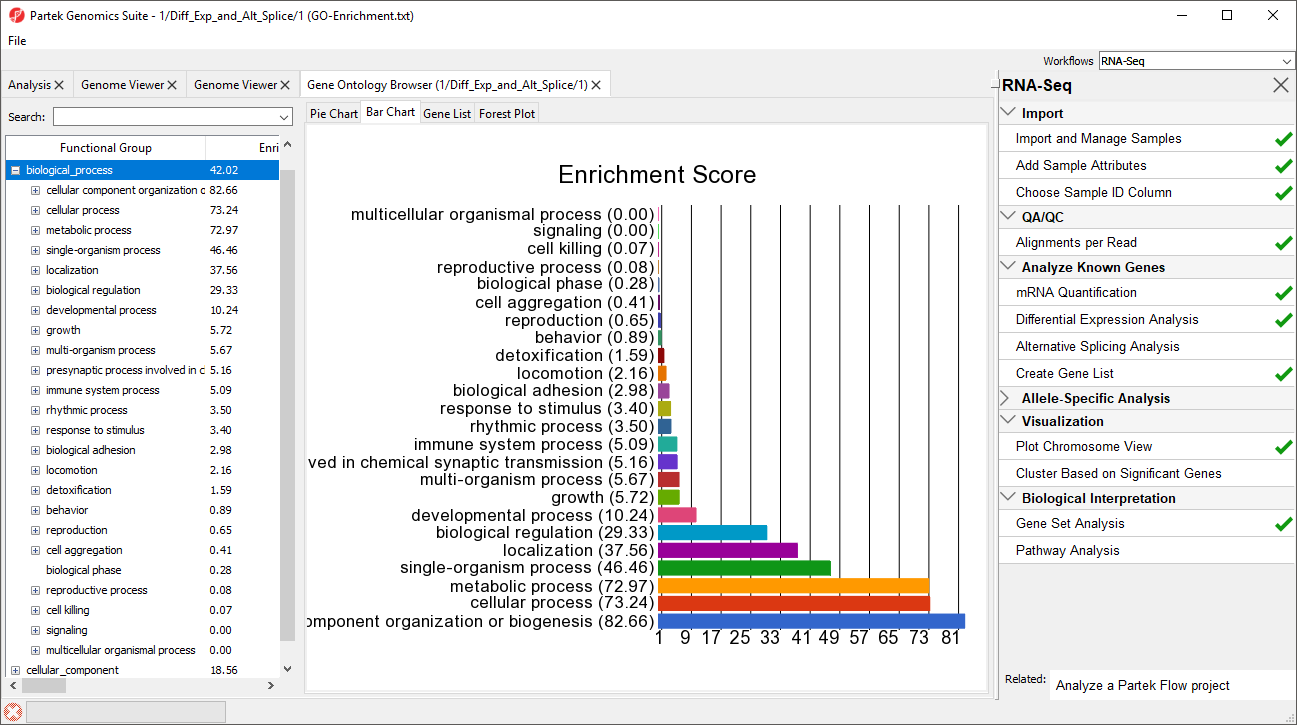
A GO-Enrichment spreadsheet, as well as a browser (Figure 6), will be generated with the enrichment score shown for each GO term. Browse through the results to find a functional group of interest by examining the enrichment scores. The higher the enrichment score, the more over represented this functional group is in the input gene list. Alternatively, you may use the Interactive filter on the GO-Enrichment spreadsheet to identify functional groups that have low p-values and perhaps a higher percentage of genes in the group that are present.
| Numbered figure captions |
|---|
| SubtitleText | Viewing the Gene Ontology Browser |
|---|
| AnchorName | Gene Ontology Browser |
|---|
|
|