Page History
...
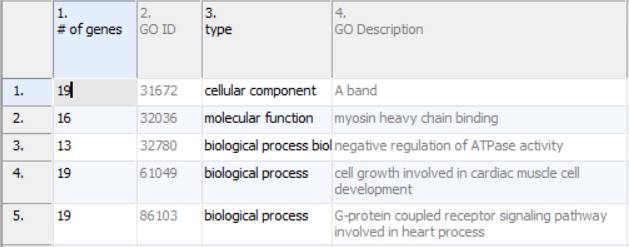
Annotations will take up the first four columns of the results sheet (Figure 1). The first column (# of genes) is the number of genes in the GO category. Specifically, this is not necessarily the number of unique genes in the category; depending on the technology, it can be the number of probes or probe sets on the microarray whose targets fall into the GO category. Genes targeted more than once will be counted more than once. The second column (GO ID) is the unique numeric identifier of the GO category; it is sometimes useful for searching with when the GO category has a very long name. The third column is the type of the GO category, while the fourth column (GO Description) is the name of the GO category.
| Numbered figure captions | ||||
|---|---|---|---|---|
| ||||
|
...
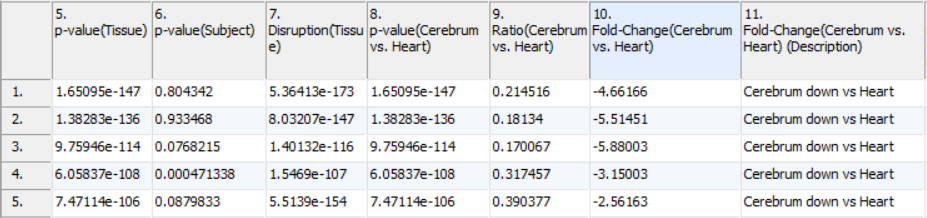
Contrast results include four columns for each of the comparisons declared during GO ANOVA setup. The first column contains the p-value representing the significance of the difference between the two categories. The second column contains the ratio between the two groups where increases are represented as greater than one and decreases are represented as values between zero and one. The third column is the fold change of the functional group between the two categories where increases are greater than one and decreases are less than negative one. The fourth column contains a plain text description of the direction of the fold change. Fold changes and ratios represent the average change in the functional category. In the example, a contrast was run comparing expression in the cerebral tissue to the heart tissue (Figure 3). As these were the only tissues, the p-values are identical to those in column 5. While the p-value column shows which groups are differentially expressed between the tissues, the fold change columns allow us to see by how much they are differentially expressed. Using the sign of the fold change, or the description column, you can see which categories are increased in brain and which are increased in heart.
| Numbered figure captions | ||||
|---|---|---|---|---|
| ||||
|
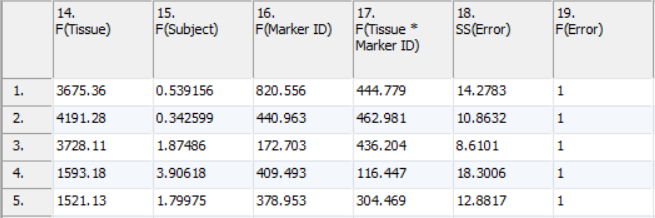
F-Ratios
F-ratios (Figure 4) are used in the computation of p-values. The values in the columns can safely be ignored by most users; there are exceptional cases when the F-ratios may be informative. To see the general significance of the factors included in the model, a Sources of Variation plot can be computed from these values from the View menu (or the Workflow). The higher the average F-ratio, the more important the factor is to the model on average.
| Numbered figure captions | ||||
|---|---|---|---|---|
| ||||
|
| Additional assistance |
|---|
|
| Rate Macro | ||
|---|---|---|
|
Overview
Content Tools