Join us for a webinar: The complexities of spatial multiomics unraveled
May 2
Page History
...
Hierarchical clustering is an unsupervised clustering method. Unsupervised clustering methods do not take the identity or attributes of samples into account when clustering. This means that experimental variables such as treatment, phenotype, tissue, number of expected groups, etc. do not guide or bias cluster building. Supervised clustering methods do consider experimental variables when building clusters.
Partek Genomics Suite offers two alternatives to Hierarchical clustering - K-Means clustering and Self-Organizing Map. For a more in-depth description of how Partek Genomics Suite performs these different forms of clustering analysis, please see Chapter 8 Hierarchical & Partitioning Clustering of the Partek Manual. The Partek Manual can be accessed through Partek® Genomics Suite® under Help > On-Line Help.
Visualizing Hierarchical Clustering
...
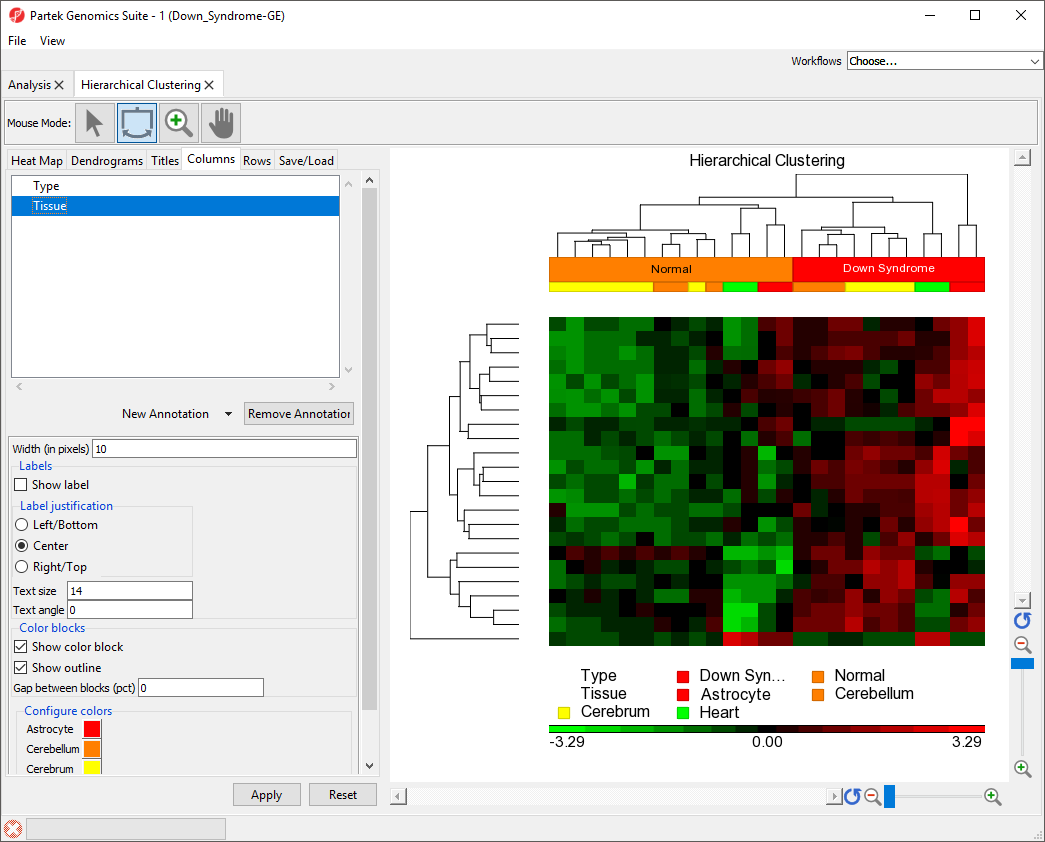
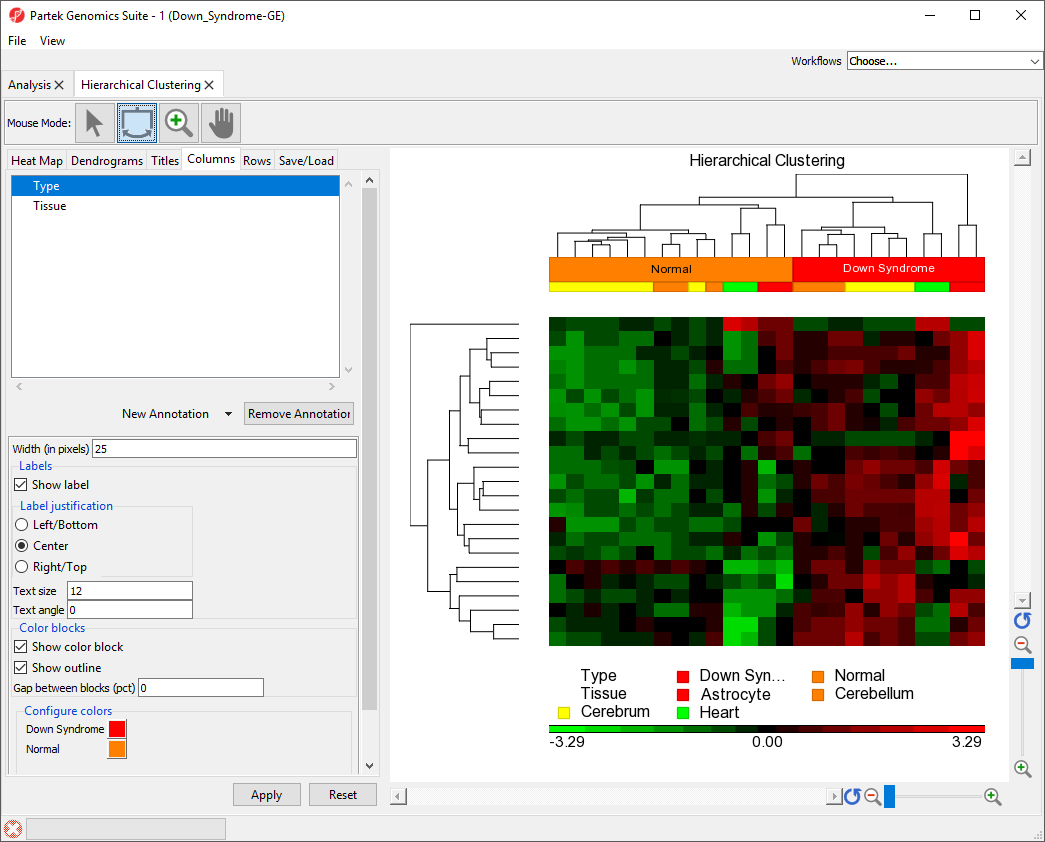
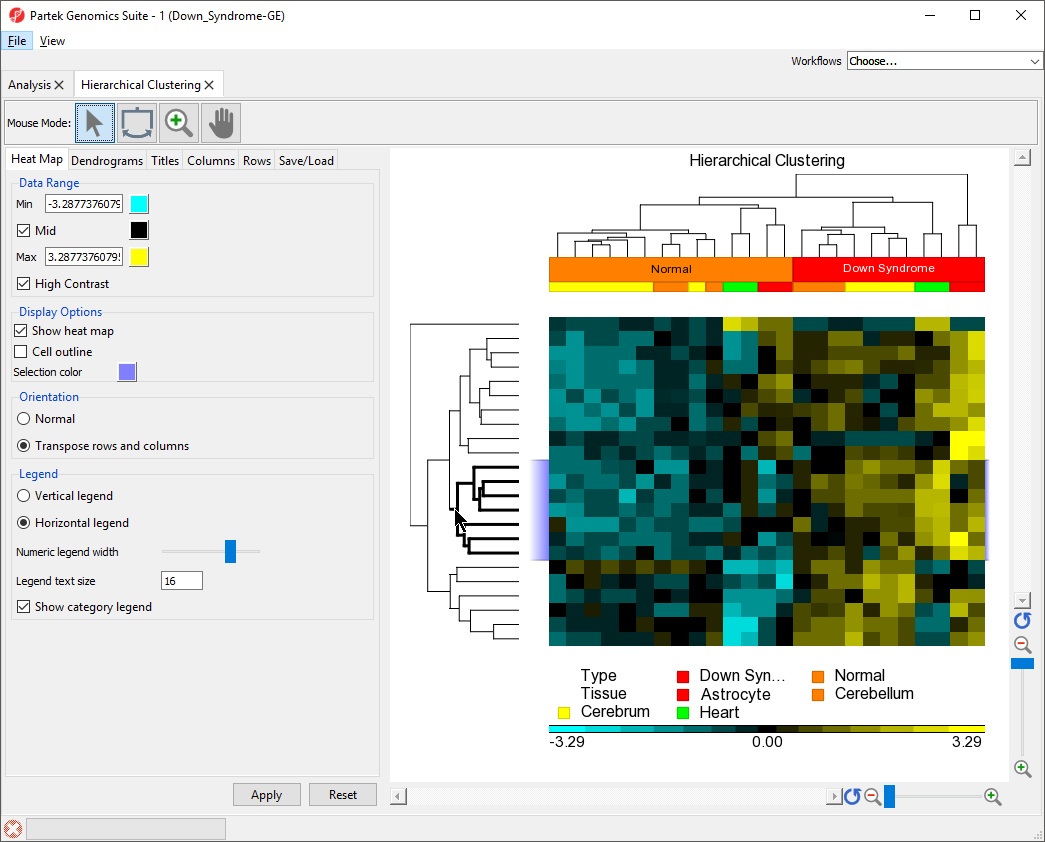
The right-hand section of the Hierarchical Clustering tab is a heat map showing relative expression of the genes in the list used to perform clustering. The heat map can be configured using the properties panel on the left-hand side of the tab. By default, down-regulated genes will be shown In this example, low expression value is colored in green, genes with no change in expression will be shown in black, and up-regulated genes will be shown in redhigh expression value is in red, the middle value between min and max is colored in black.The dendograms on the left-hand side and top of the heat map show clustering of samples as rows and features (probes/genes in this example) as columns. Columns are labeled with the gene symbol if there is enough space for every gene to be annotated. Rows are colored based on the groups of the first sample categorical attribute in the source spreadsheet. The sample legend below the heat map indicates which colors correspond to which attribute group. In this example, Down syndrome patient samples are red and normal patient samples are orange.
...
| Numbered figure captions | ||||
|---|---|---|---|---|
| ||||
|
Flipping Columns or Rows
Any of the denograms legs can be flipped to reorient Each cluster node has two sub-cluster branches (legs) except for the bottom level in the dendrogram, the order of the two branches (or legs) is arbitrary, so the two sub-clusters position can be flipped within the cluster. This does not change the clustering, only the position of the clusters on the plot.
- Select (
 ) from the Mouse Mode icon set to activate Flip Mode
 - Click on the dendogram leg associated with the bottom row
...
- a line (or draw a bounding box on a line using left mouse button) which represents a sub-cluster branch (or leg) will flip the selected leg with the other one leg within the same parent cluster. In this example, click on the bottom line will move it to the top of the heat map (Figure 5).
| Numbered figure captions | ||||
|---|---|---|---|---|
| ||||
|
...
- Select (
 ) from the Mouse Mode icon set to activate Selection Mode
 - Select on the middle cluster of the rows denodgram dendrogram as shown (Figure 7) to select it
...
- by clicking on the line or draw a bounding box on the line
The lines within the selected cluster will be bold and the corresponding columns (or rows) on the spreadsheet in the analysis tab will be highlighted.
| Numbered figure captions | ||||
|---|---|---|---|---|
| ||||
|
- Right-click on the dendogramSelect any where in the viewer to select Zoom to Fit Selected Rows
...
- Select (
 ) on the y-axis to show all rows
 - Click Left click anywhere in the hierarchical clustering plot to deselect the dendogram dendrogram
Exporting a List of Genes From a Selected Cluster
...
- Select () from the Mouse Mode icon set to activate Selection Mode
- Select the bottom cluster of the rows dendogram dendrogram
- Right-click to open the pop-up menu
- Select Create Row List... (Figure 9)
...
Overview
Content Tools