Page History
...
| Numbered figure captions | ||||
|---|---|---|---|---|
| ||||
|
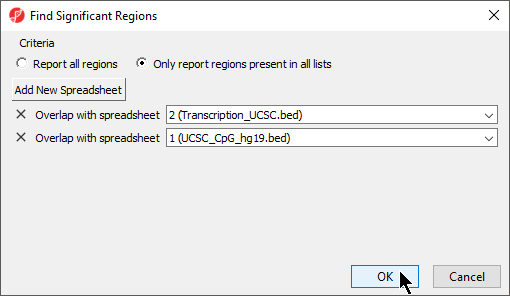
The Find Region Overlaps tool has two modes of operation. The first, Report all regions, creates a new spreadsheet with any regions that did not intersect and all regions of intersection between any of the input lists. For each intersection, the start and stop coordinates of the intersection and the percent overlap between the intersected region with each of the regions in the input lists are reported. The second, Only report regions present in all lists creates a new spreadsheet with the intersected regions found in all the lists.
- Select your preferred mode; we have selected Only report regions present in all lists
- Select Add New Spreadsheet to add any spreadsheets you want to compare; we are comparing two region list spreadsheets (Figure 6)
- Select OK
| Numbered figure captions | ||||
|---|---|---|---|---|
| ||||
|
...
| Numbered figure captions | ||||
|---|---|---|---|---|
| ||||
|
Save as either a tab-separated or comma separated file
Import the table as a text file
Select Genomic data for What type of data is this file?
Set the position column Type to text
Set the other columns Type to categorical
Select Genomic location instead of marker IDs from the Choose the type of genomic data drop-down menu of the Configure Genomic Properties dialog
Specify the Species and Genome Build
Select OK
The Annotate SNVs tool can now be invoked on this spreadsheet to generate an annotation spreadsheet (Figure 9).
...
Overview
Content Tools