Join us for a webinar: The complexities of spatial multiomics unraveled
May 2
Page History
...
Hierarchical clustering groups similar objects into clusters. To To start, each row and/or column is considered a cluster. The two most similar clusters are then combined and this process is iterated until all objects are in the same cluster. Hierarchical clustering displays the resulting hierarchy of the clusters in a tree called a dendogram. Hierarchical clustering is useful for exploratory analysis because it shows how samples group together based on similarity of features.
Hierarchical clustering is considered an unsupervised clustering method. Unsupervised clustering methods do not take the identity or attributes of samples into account when clustering. This means that experimental variables such as treatment, phenotype, tissue, number of expected groups, etc. do not guide or bias cluster building. Alternatively, supervised Supervised clustering methods do consider experimental variables when building clusters.
...
We can use the hierarchical clustering heat map to examine groups of genes that exhibit similar expression patterns. For example, genes that are up-regulated in Downs Down syndrome samples and down-regulated in normal samples.
...
The same steps can be used to zoom into columns or rows. Here, we have zoomed in on the rows, but not columns to show the expression levels of the selected genes for all samples (Figure 8).
...
To reset zoom select (![]() ) on the xy-axis to show all columns rows and the yx-axis to show all rowscolumns.
) on the xy-axis to show all columns rows and the yx-axis to show all rowscolumns.
- Select (
 ) on the y-axis to show all rows
 - Click anywhere in the hierarchical clustering plot to deselect the dendogram
...
- Select (
 ) from the Mouse Mode icon set to activate Selection Mode
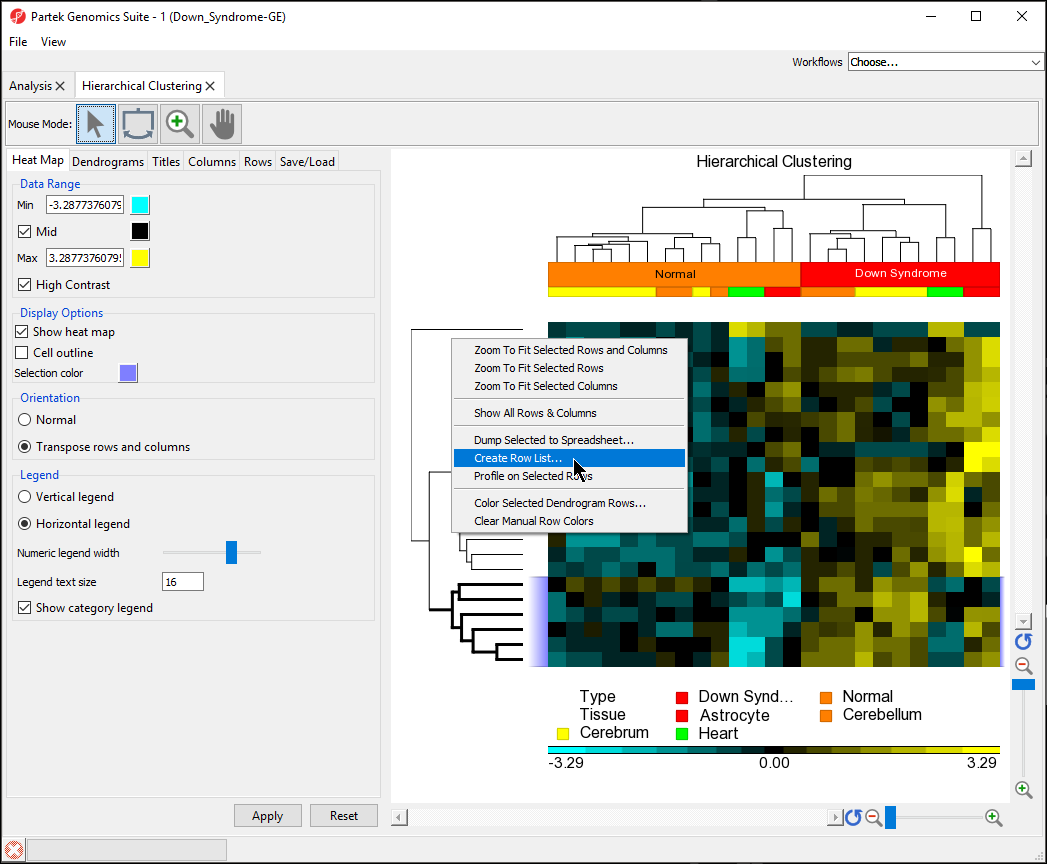
 - Select the bottom cluster of the rows dendogram (Figure 9dendogram
- Right-click to open the pop-up menu
- Select Create Row List... (Figure 9)
| Numbered figure captions | ||||
|---|---|---|---|---|
| ||||
|
- Name the gene set Down down in normal
- Select OK
- Save the list as down in normal
In the Analysis tab, there is now a spreadsheet row_list (down in normal.txt) containing the 6 genes that were in the selected cluster. The same steps can be used to create a list of samples form from the hierarchical clustering by selecting clusters on the sample dendogram.
...
Once you have created a customized plot, you can save the plot properties as a template to use in for future hierarchical clustering analyses.
- Select the Save/Load tab
- Select Save current...
- Name the current plot properties template, ; we selected Transposed Blue and Yellow
...
Overview
Content Tools