Page History
...
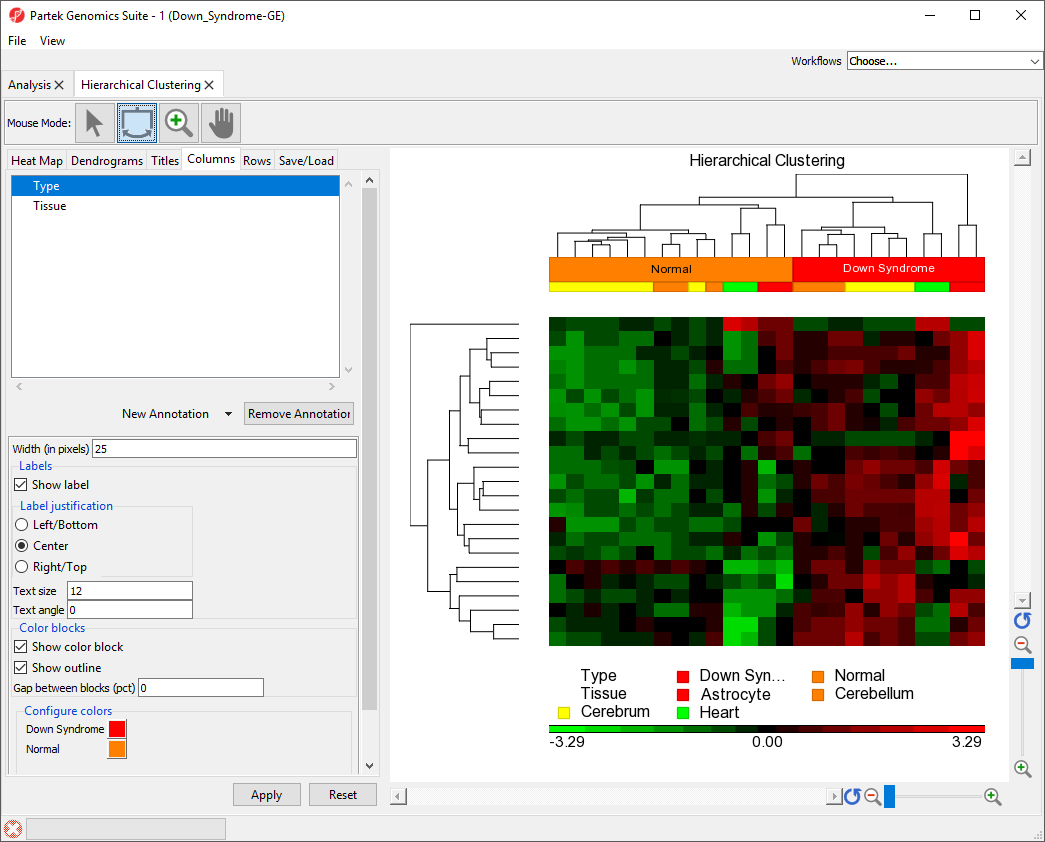
Hierarchical clustering groups similar objects into clusters. To start, each row and/or column is considered a cluster. The two most similar clusters are then combined and this process is iterated until all objects are in the same cluster. Hierarchical clustering displays the resulting hierarchy of the clusters in a tree called a dendogramdendrogram. Hierarchical clustering is useful for exploratory analysis because it shows how samples group together based on similarity of features.
...
The right-hand section of the Hierarchical Clustering tab is a heat map showing relative expression of the genes in the list used to perform clustering. The heat map can be configured using the properties panel on the left-hand side of the tab. In this example, the low expression value is colored in green, the high expression value is in red, and the middle mid-point value between min and max is colored in black.The dendograms dendrograms on the left-hand side and top of the heat map show clustering of samples as rows and features (probes/genes in this example) as columns. Columns are labeled with the gene symbol if there is enough space for every gene to be annotated. Rows are colored based on the groups of the first sample categorical attribute in the source spreadsheet. The sample legend below the heat map indicates which colors correspond to which attribute group. In this example, Down syndrome patient samples are red and normal patient samples are orange.
...
- Select () from the Mouse Mode icon set to activate Flip Mode
- Click Clicking on a line (or draw drawing a bounding box on a line using left mouse button) which that represents a sub-cluster branch (or dendrogram leg) will flip the selected leg with the other one leg within the same parent cluster. In this example, click clicking on the bottom line will move it to the top of the heat map (Figure 5).
...
| Numbered figure captions | ||||
|---|---|---|---|---|
| ||||
|
...
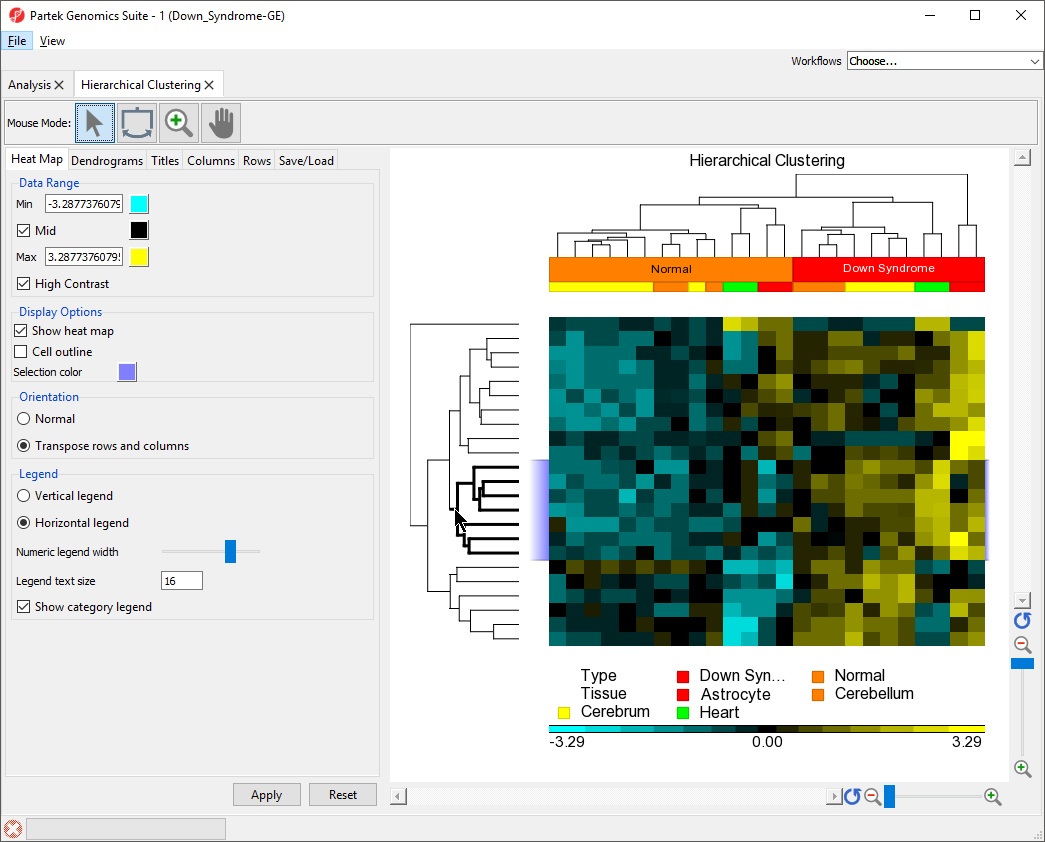
- Select () from the Mouse Mode icon set to activate Selection Mode
- Select on the middle cluster of the rows dendrogram as shown (Figure 7) by clicking on the line or draw drawing a bounding box on around the line
The lines within the selected cluster will be bold and the corresponding columns (or rows) on the spreadsheet in the analysis tab will be highlighted.
...
| Numbered figure captions | ||||
|---|---|---|---|---|
| ||||
- Right-click any where anywhere in the viewer to select viewer
- Select Zoom to Fit Selected Rows
...
In the Analysis tab, there is now a spreadsheet row_list (down in normal.txt) containing the 6 genes that were in the selected cluster. The same steps can be used to create a list of samples from the hierarchical clustering by selecting clusters on the sample dendogramdendrogram.
Saving Plot Properties
...

