Page History
...
This user guide assumes the user is familiar with the hierarchy of spreadsheets and analysis in Partek ® Genomics Suite®.
Many plots available in Partek Genomics Suite are not discussed in this user guide. A more thorough review of Partek Genomics Suite visualizations can be found in Chapter 6: The Pattern Visualization System of the Partek User's Manual available from Help > User’s Manual in the Partek Genomics Suite main toolbar.
...
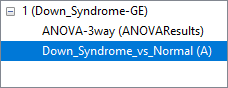
In general, probe(set)/gene intensity values may be visualized from either an ANOVA spreadsheet or a filtered ANOVA spreadsheet. Because intensity data is stored in the parent spreadsheet, the parent and child spreadsheets should be visible in the spreadsheet navigator with the appropriate parent/child relationship (Figure 1).
| Numbered figure captions | ||||
|---|---|---|---|---|
| ||||
|
| Additional assistance |
|---|
| Rate Macro | ||
|---|---|---|
|
...
Overview
Content Tools