Join us for an event September 26!
How to Streamline RNA-Seq analysis and increase productivity—point, click, and done
Page History
...
| Numbered figure captions | ||||
|---|---|---|---|---|
| ||||
|
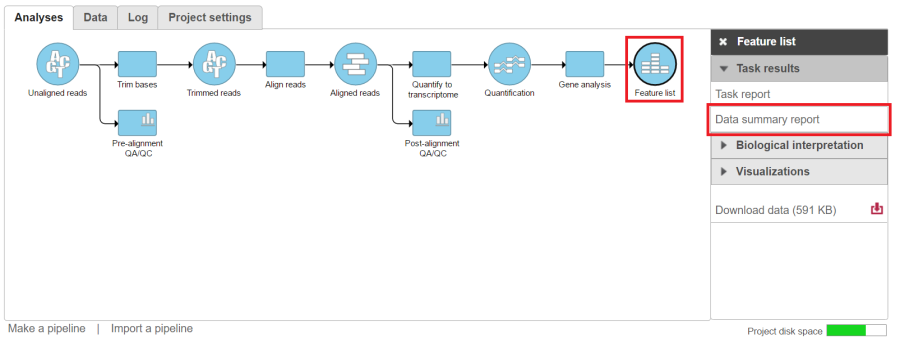
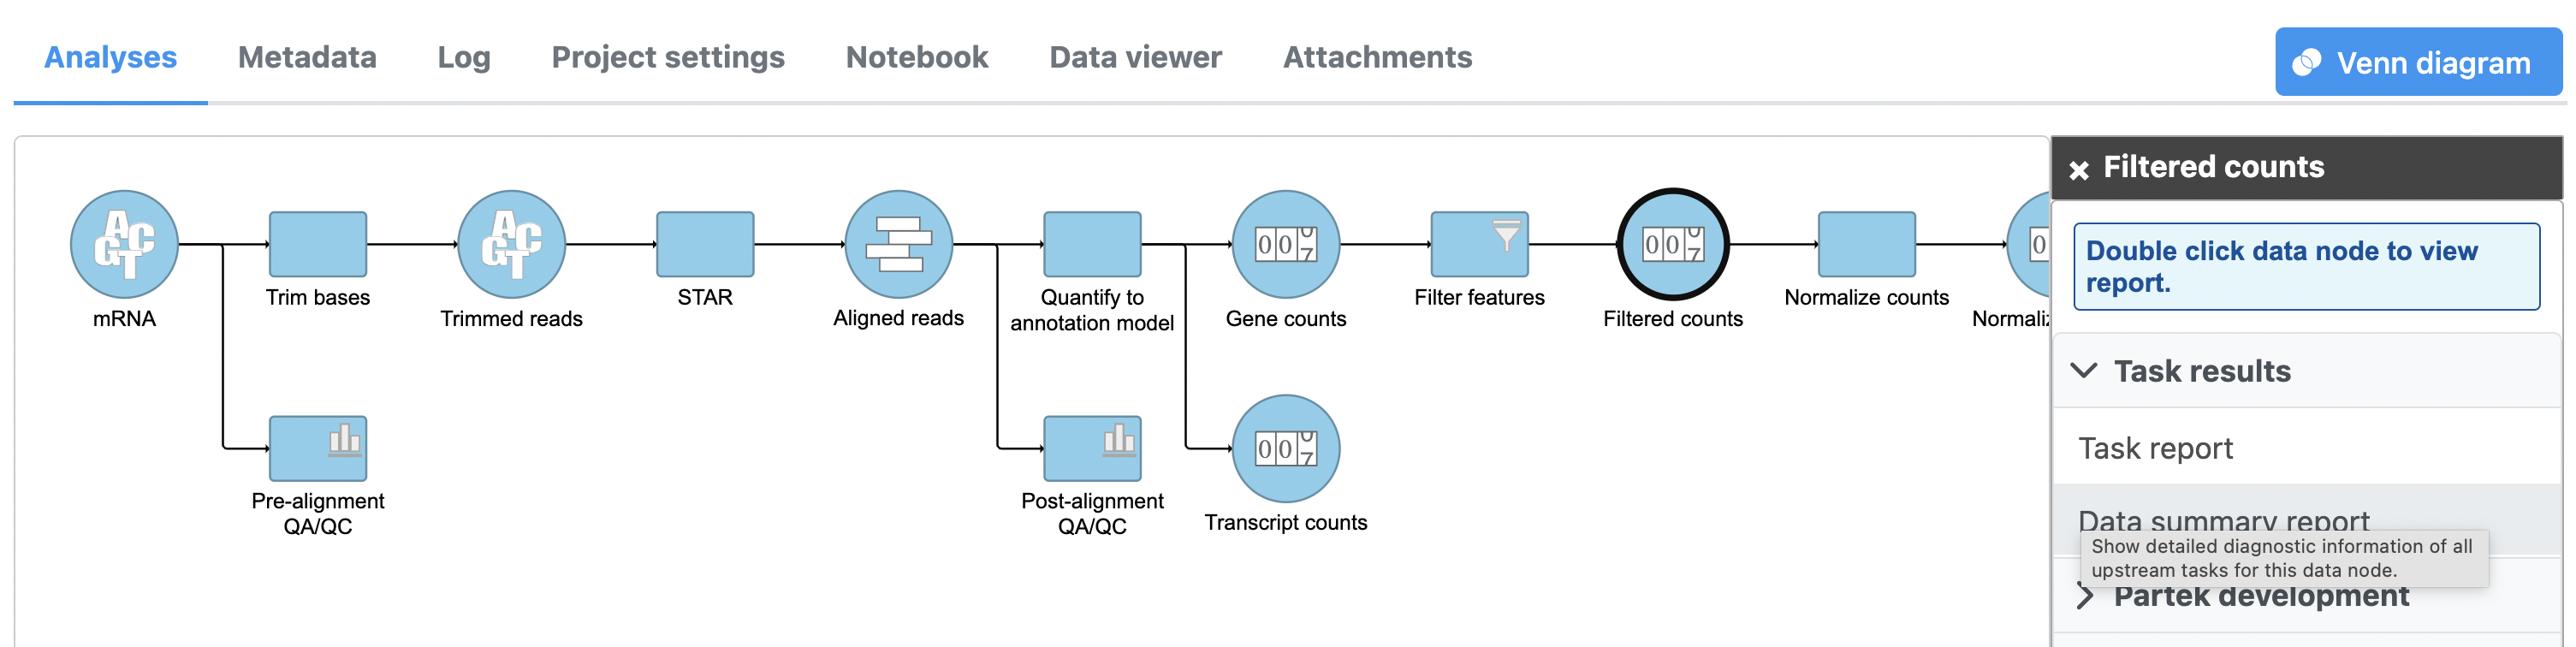
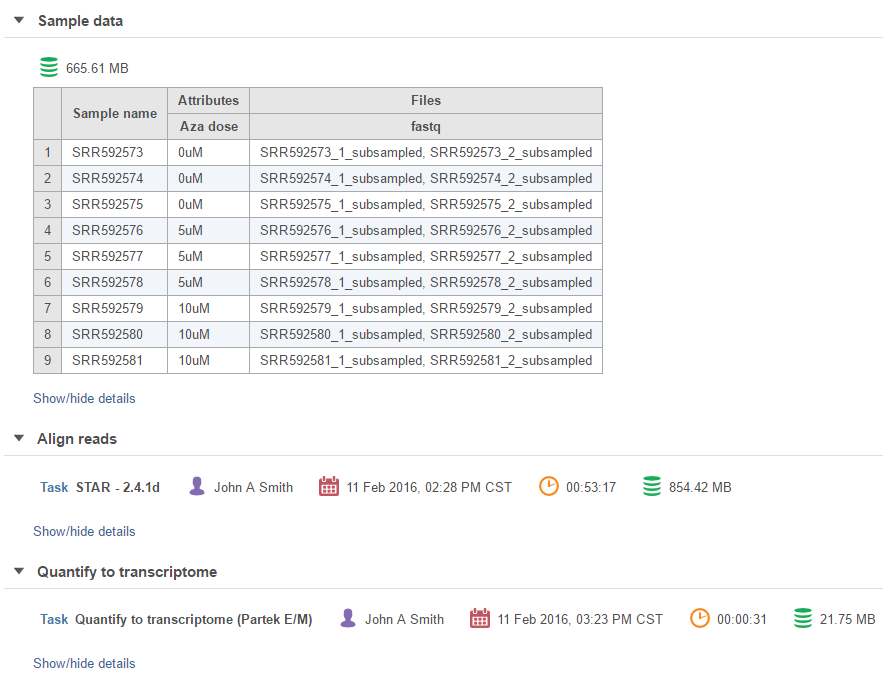
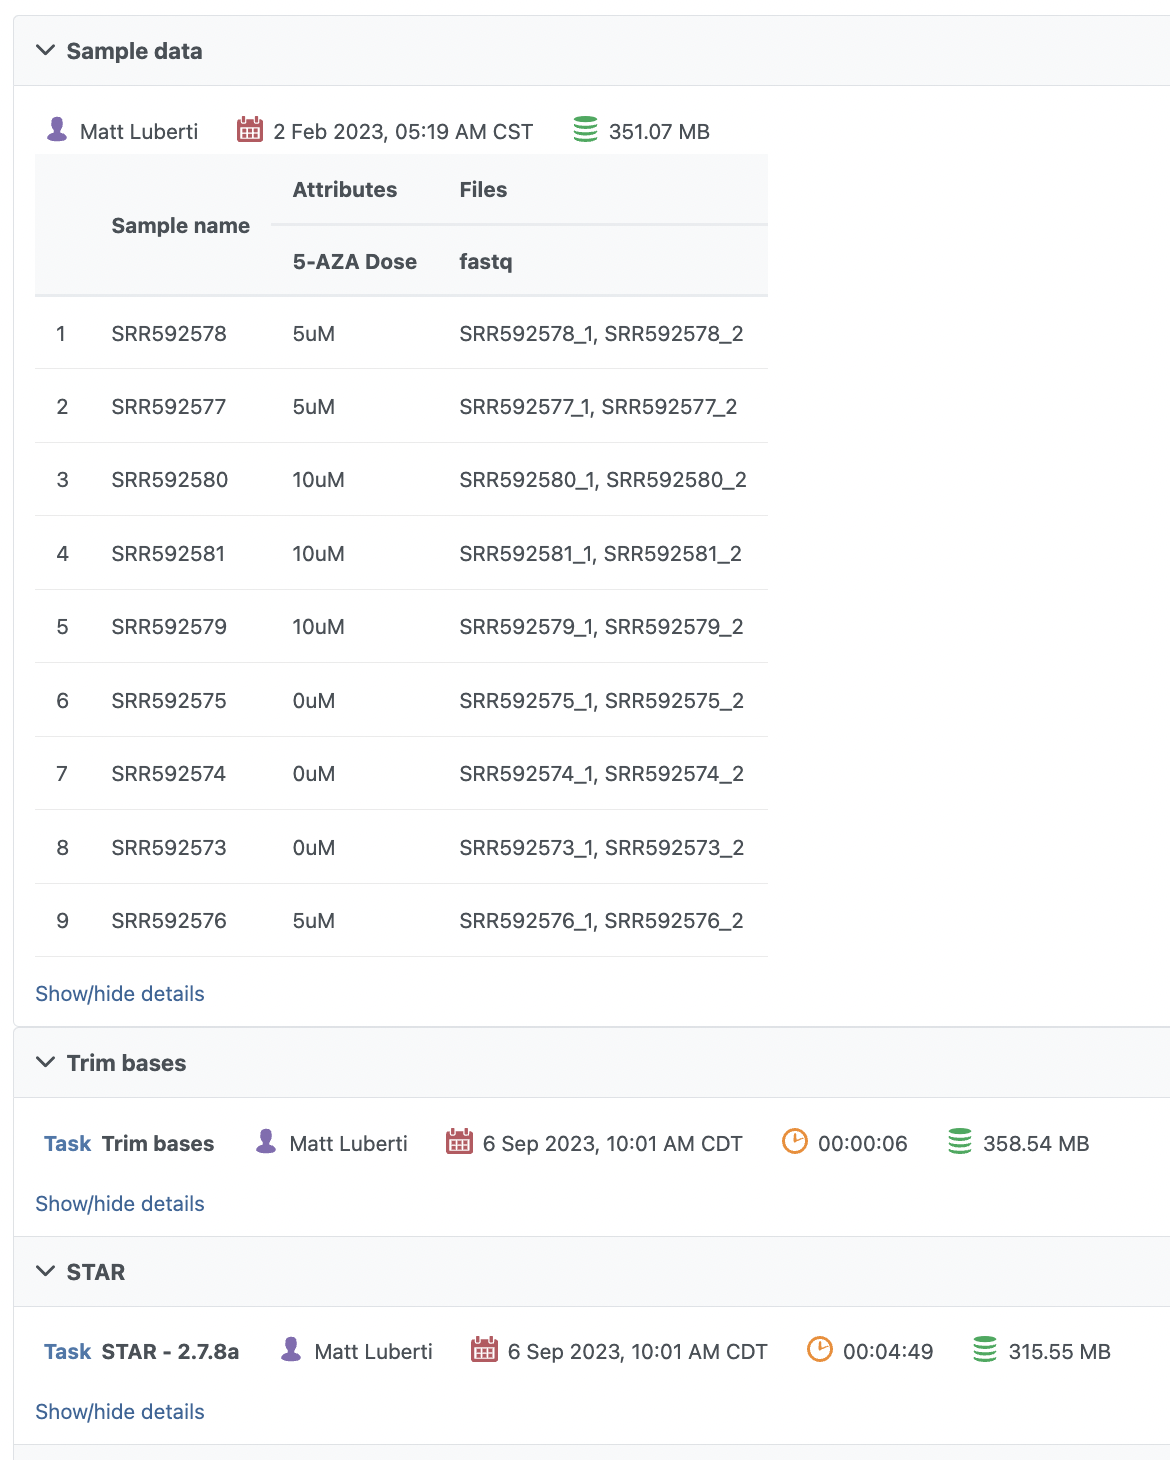
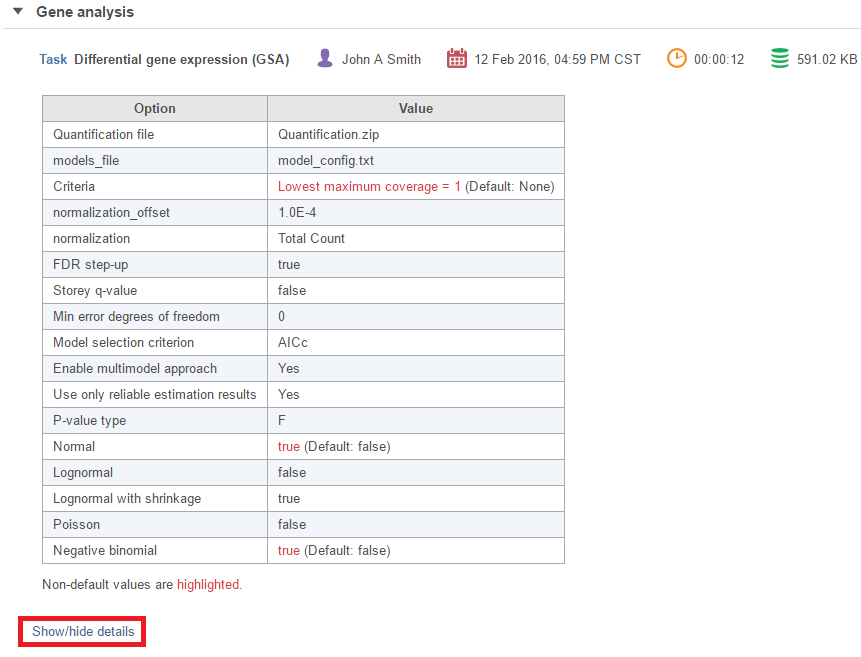
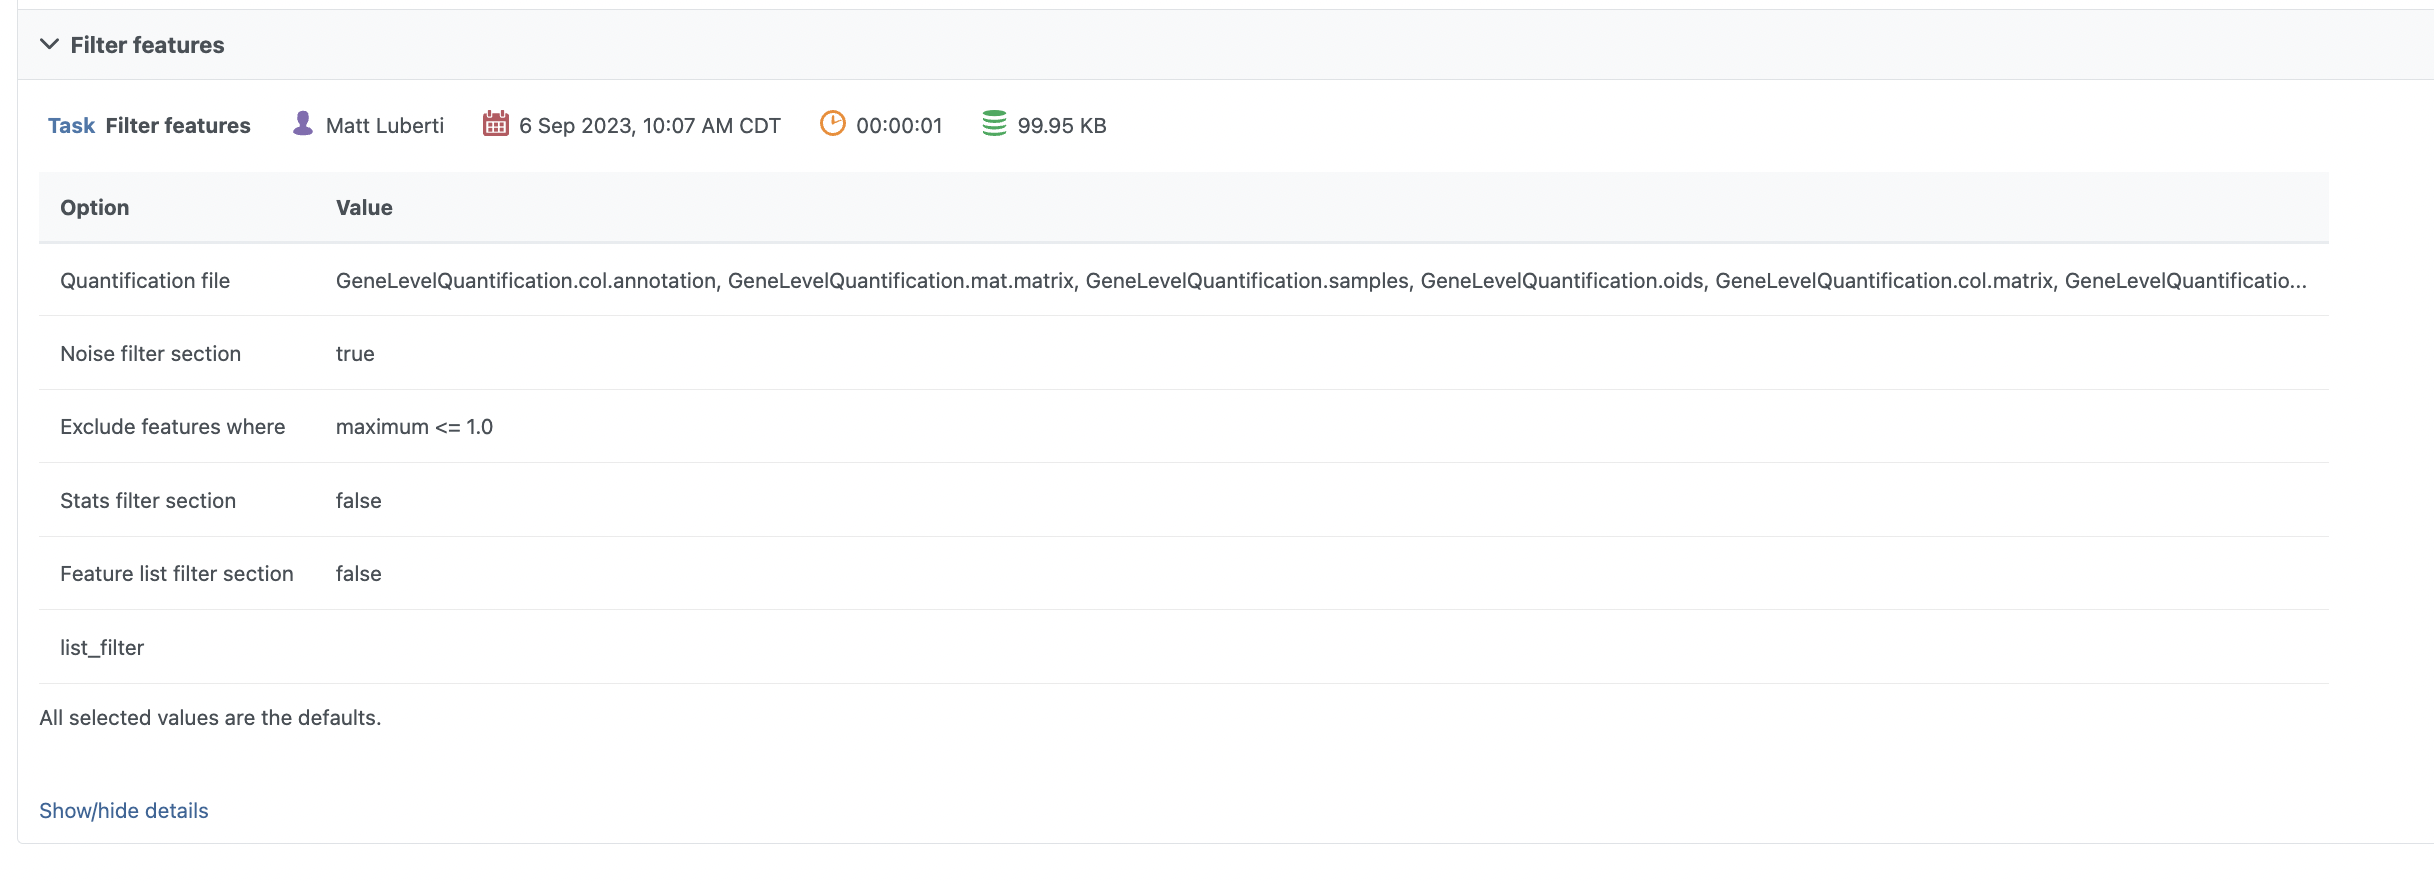
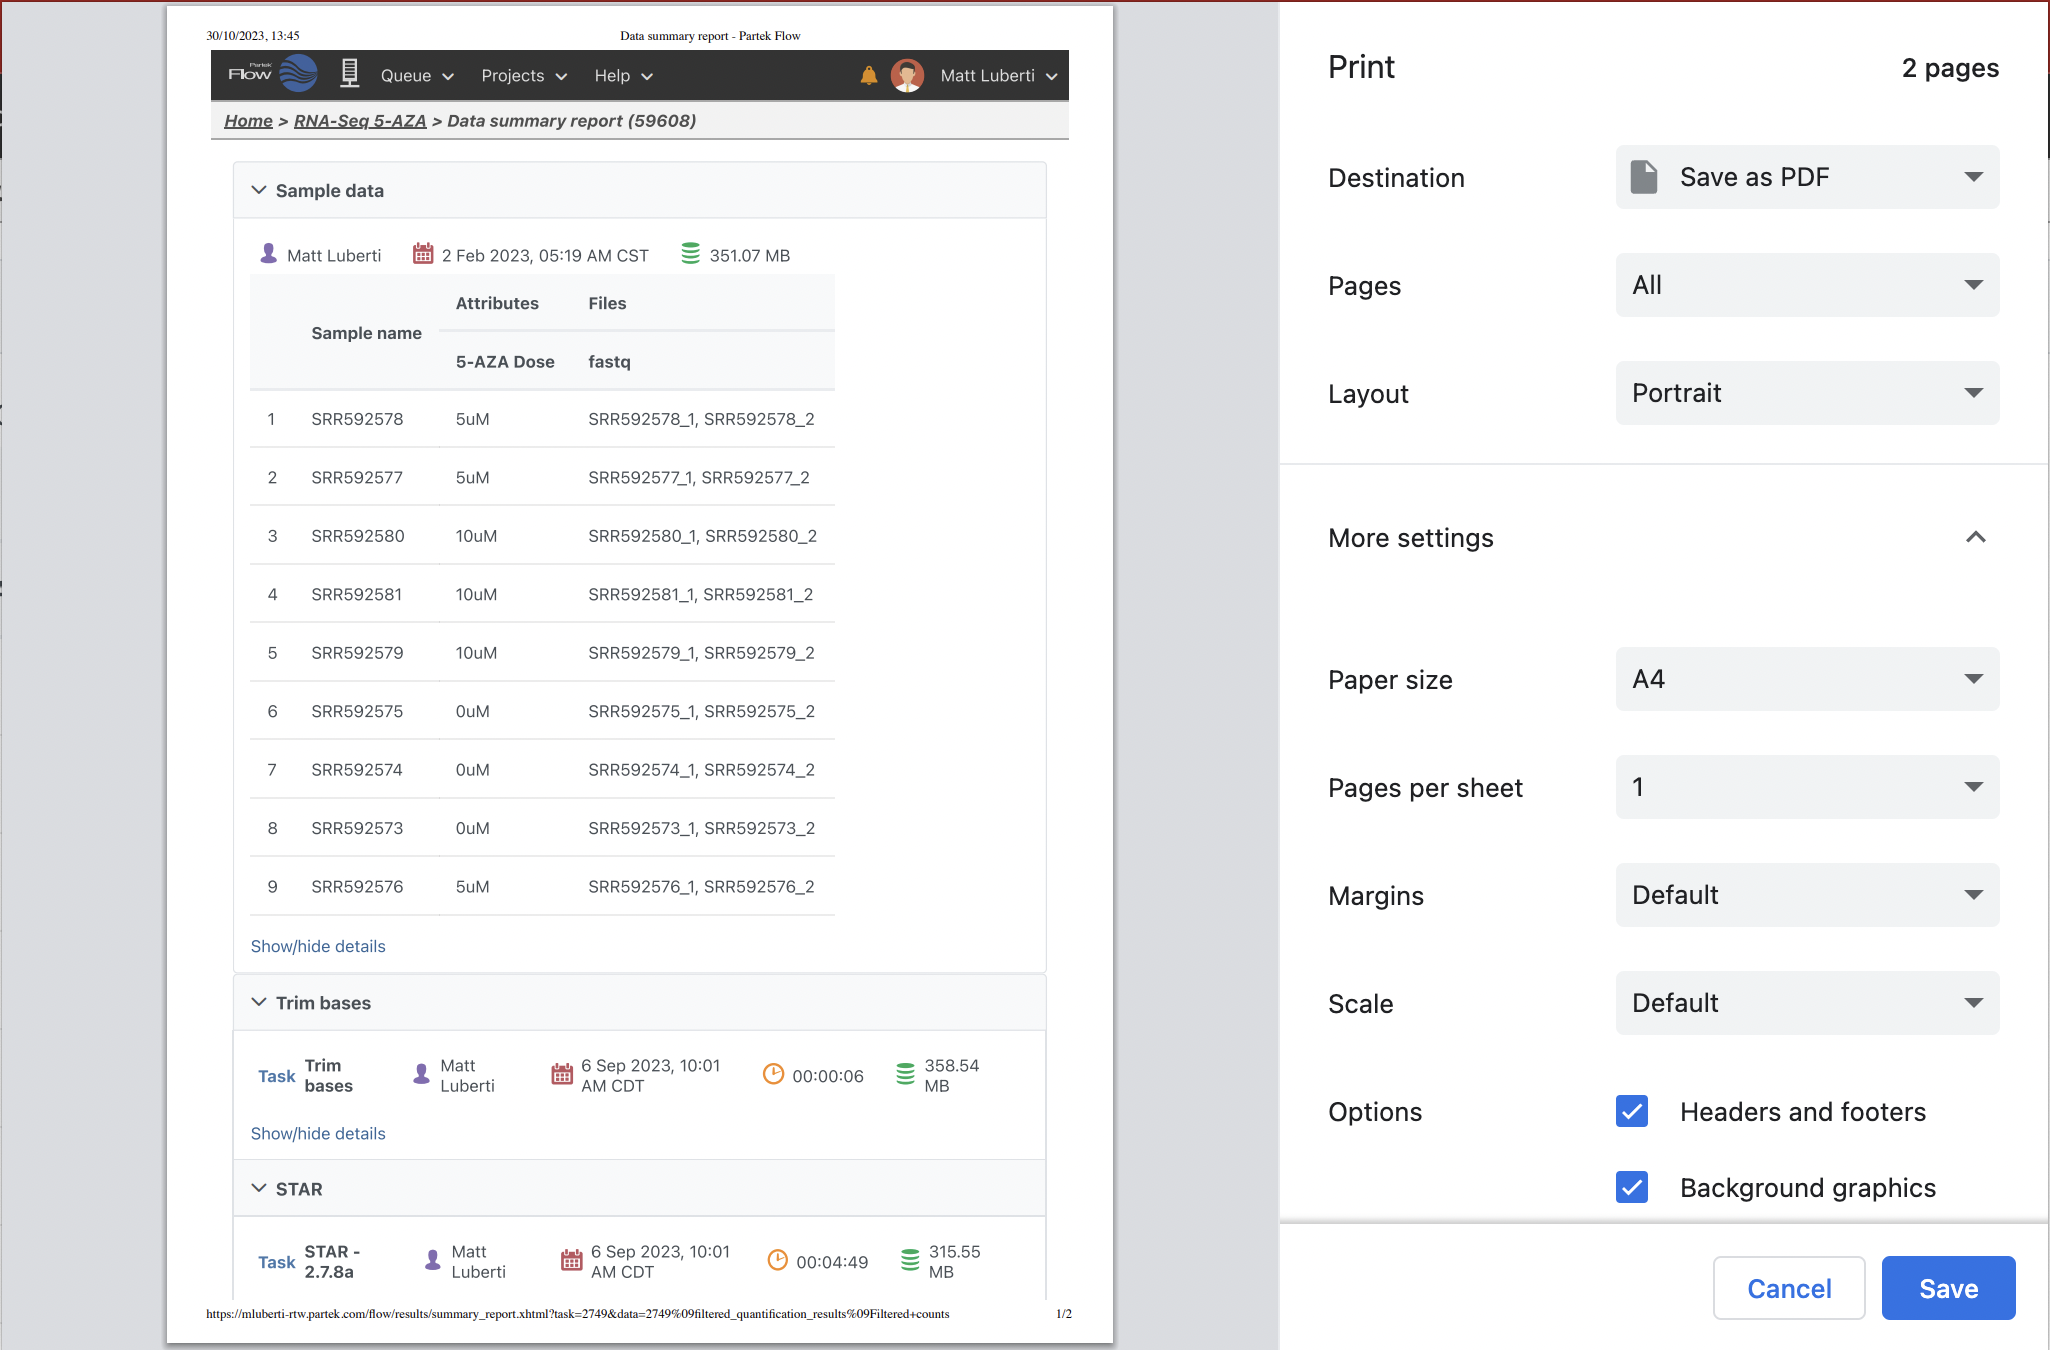
Each task will appear as a separate section on the Data summary report (Figure 2). The first section of the report (Sample data) will summarize the input samples information. Click the grey arrows ( /
) to expand and collapse each section. When expanded, the task name, user that performed the task, start date and time, duration and the output file size are displayed (Figure 2). To view or hide a table of task settings, click Show/hide details (Figure 3).
...
| Numbered figure captions | ||||
|---|---|---|---|---|
| ||||
|
| Numbered figure captions | ||||
|---|---|---|---|---|
| ||||
|
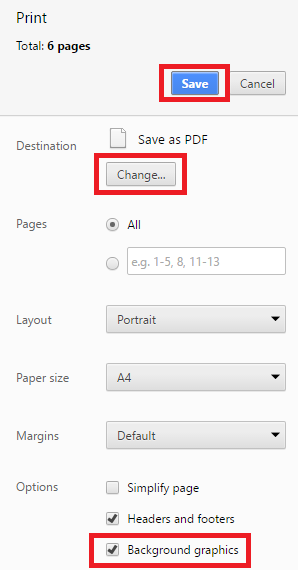
Saving the Data Summary Report
...
| Numbered figure captions | ||||
|---|---|---|---|---|
| ||||
|
| Numbered figure captions | ||||
|---|---|---|---|---|
| ||||
|
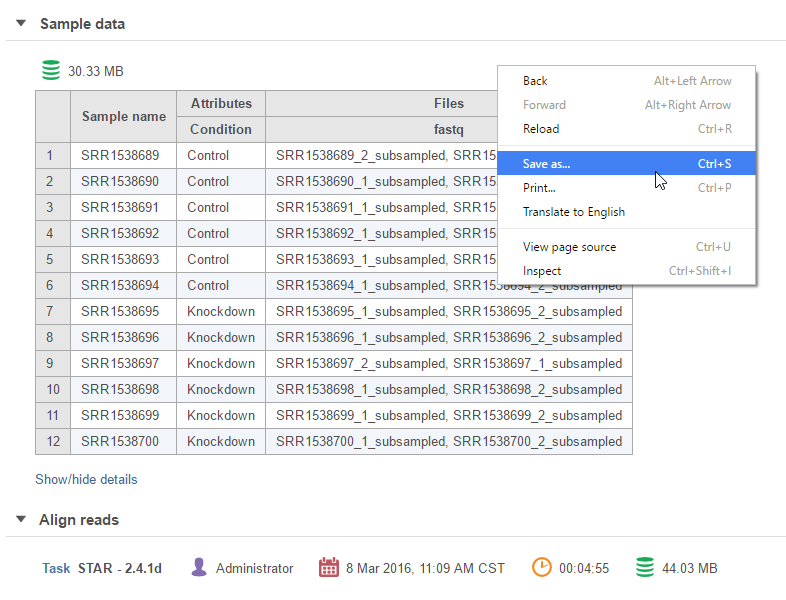
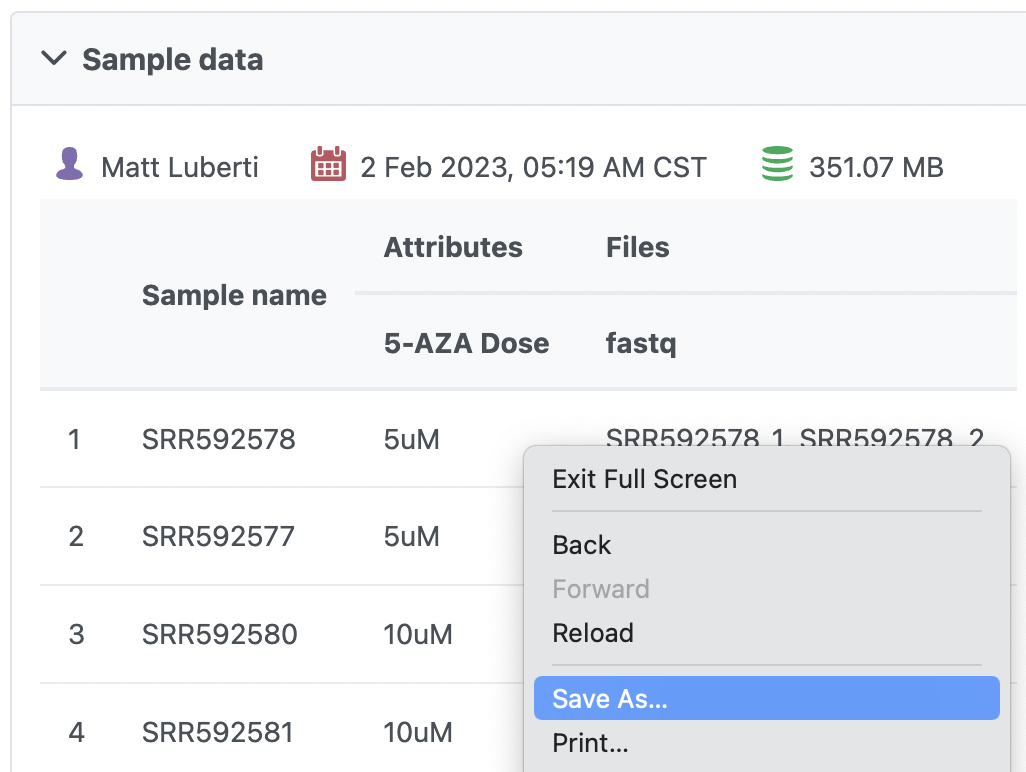
Save as HTML
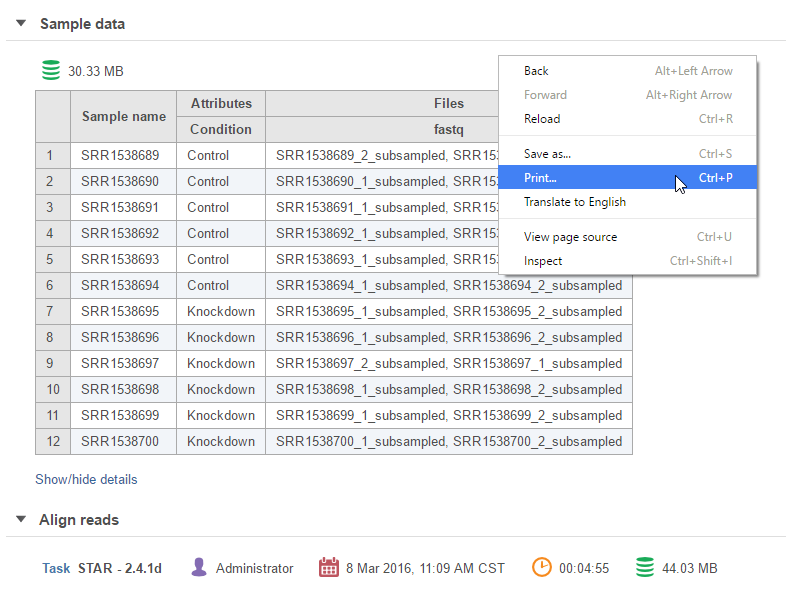
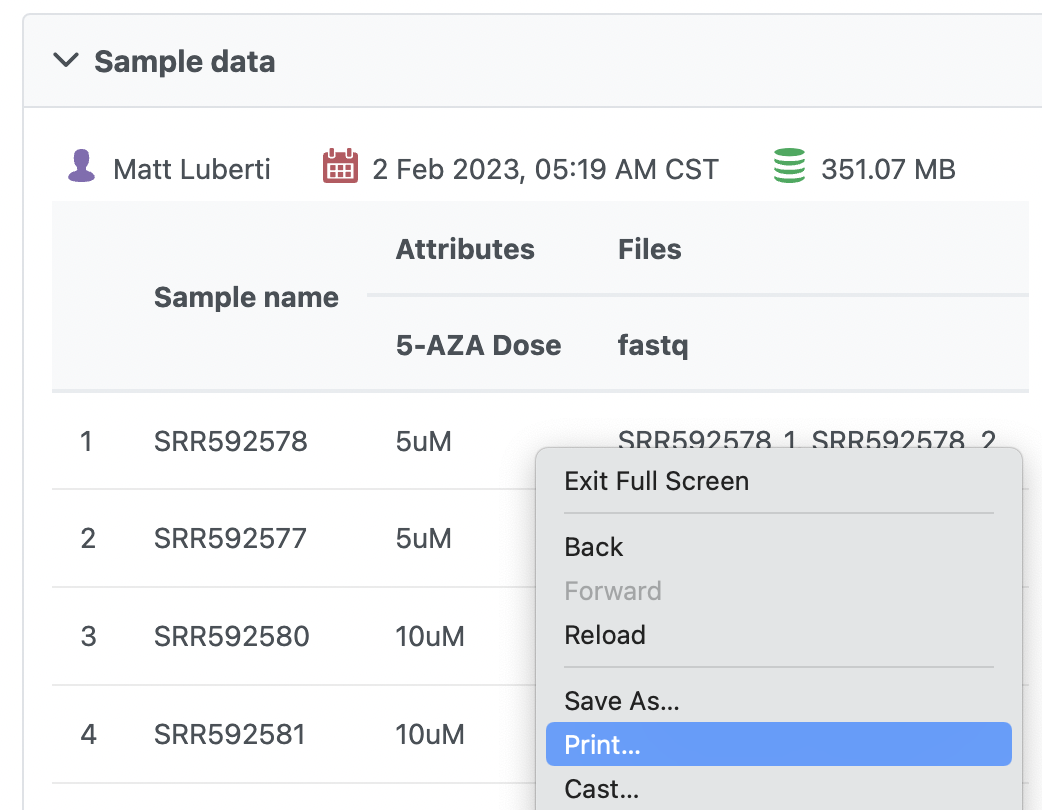
On the Data summary report, right-click anywhere on the page and choose Save as… from the menu (Figure 6) or use Ctrl+S (Command+S on Mac). Choose a file location on your local machine and set the file type to Web Page, Complete.
...
| Numbered figure captions | ||||
|---|---|---|---|---|
| ||||
|
Quick Video Demo of the Data Summary Report
...
Overview
Content Tools