Page History
...
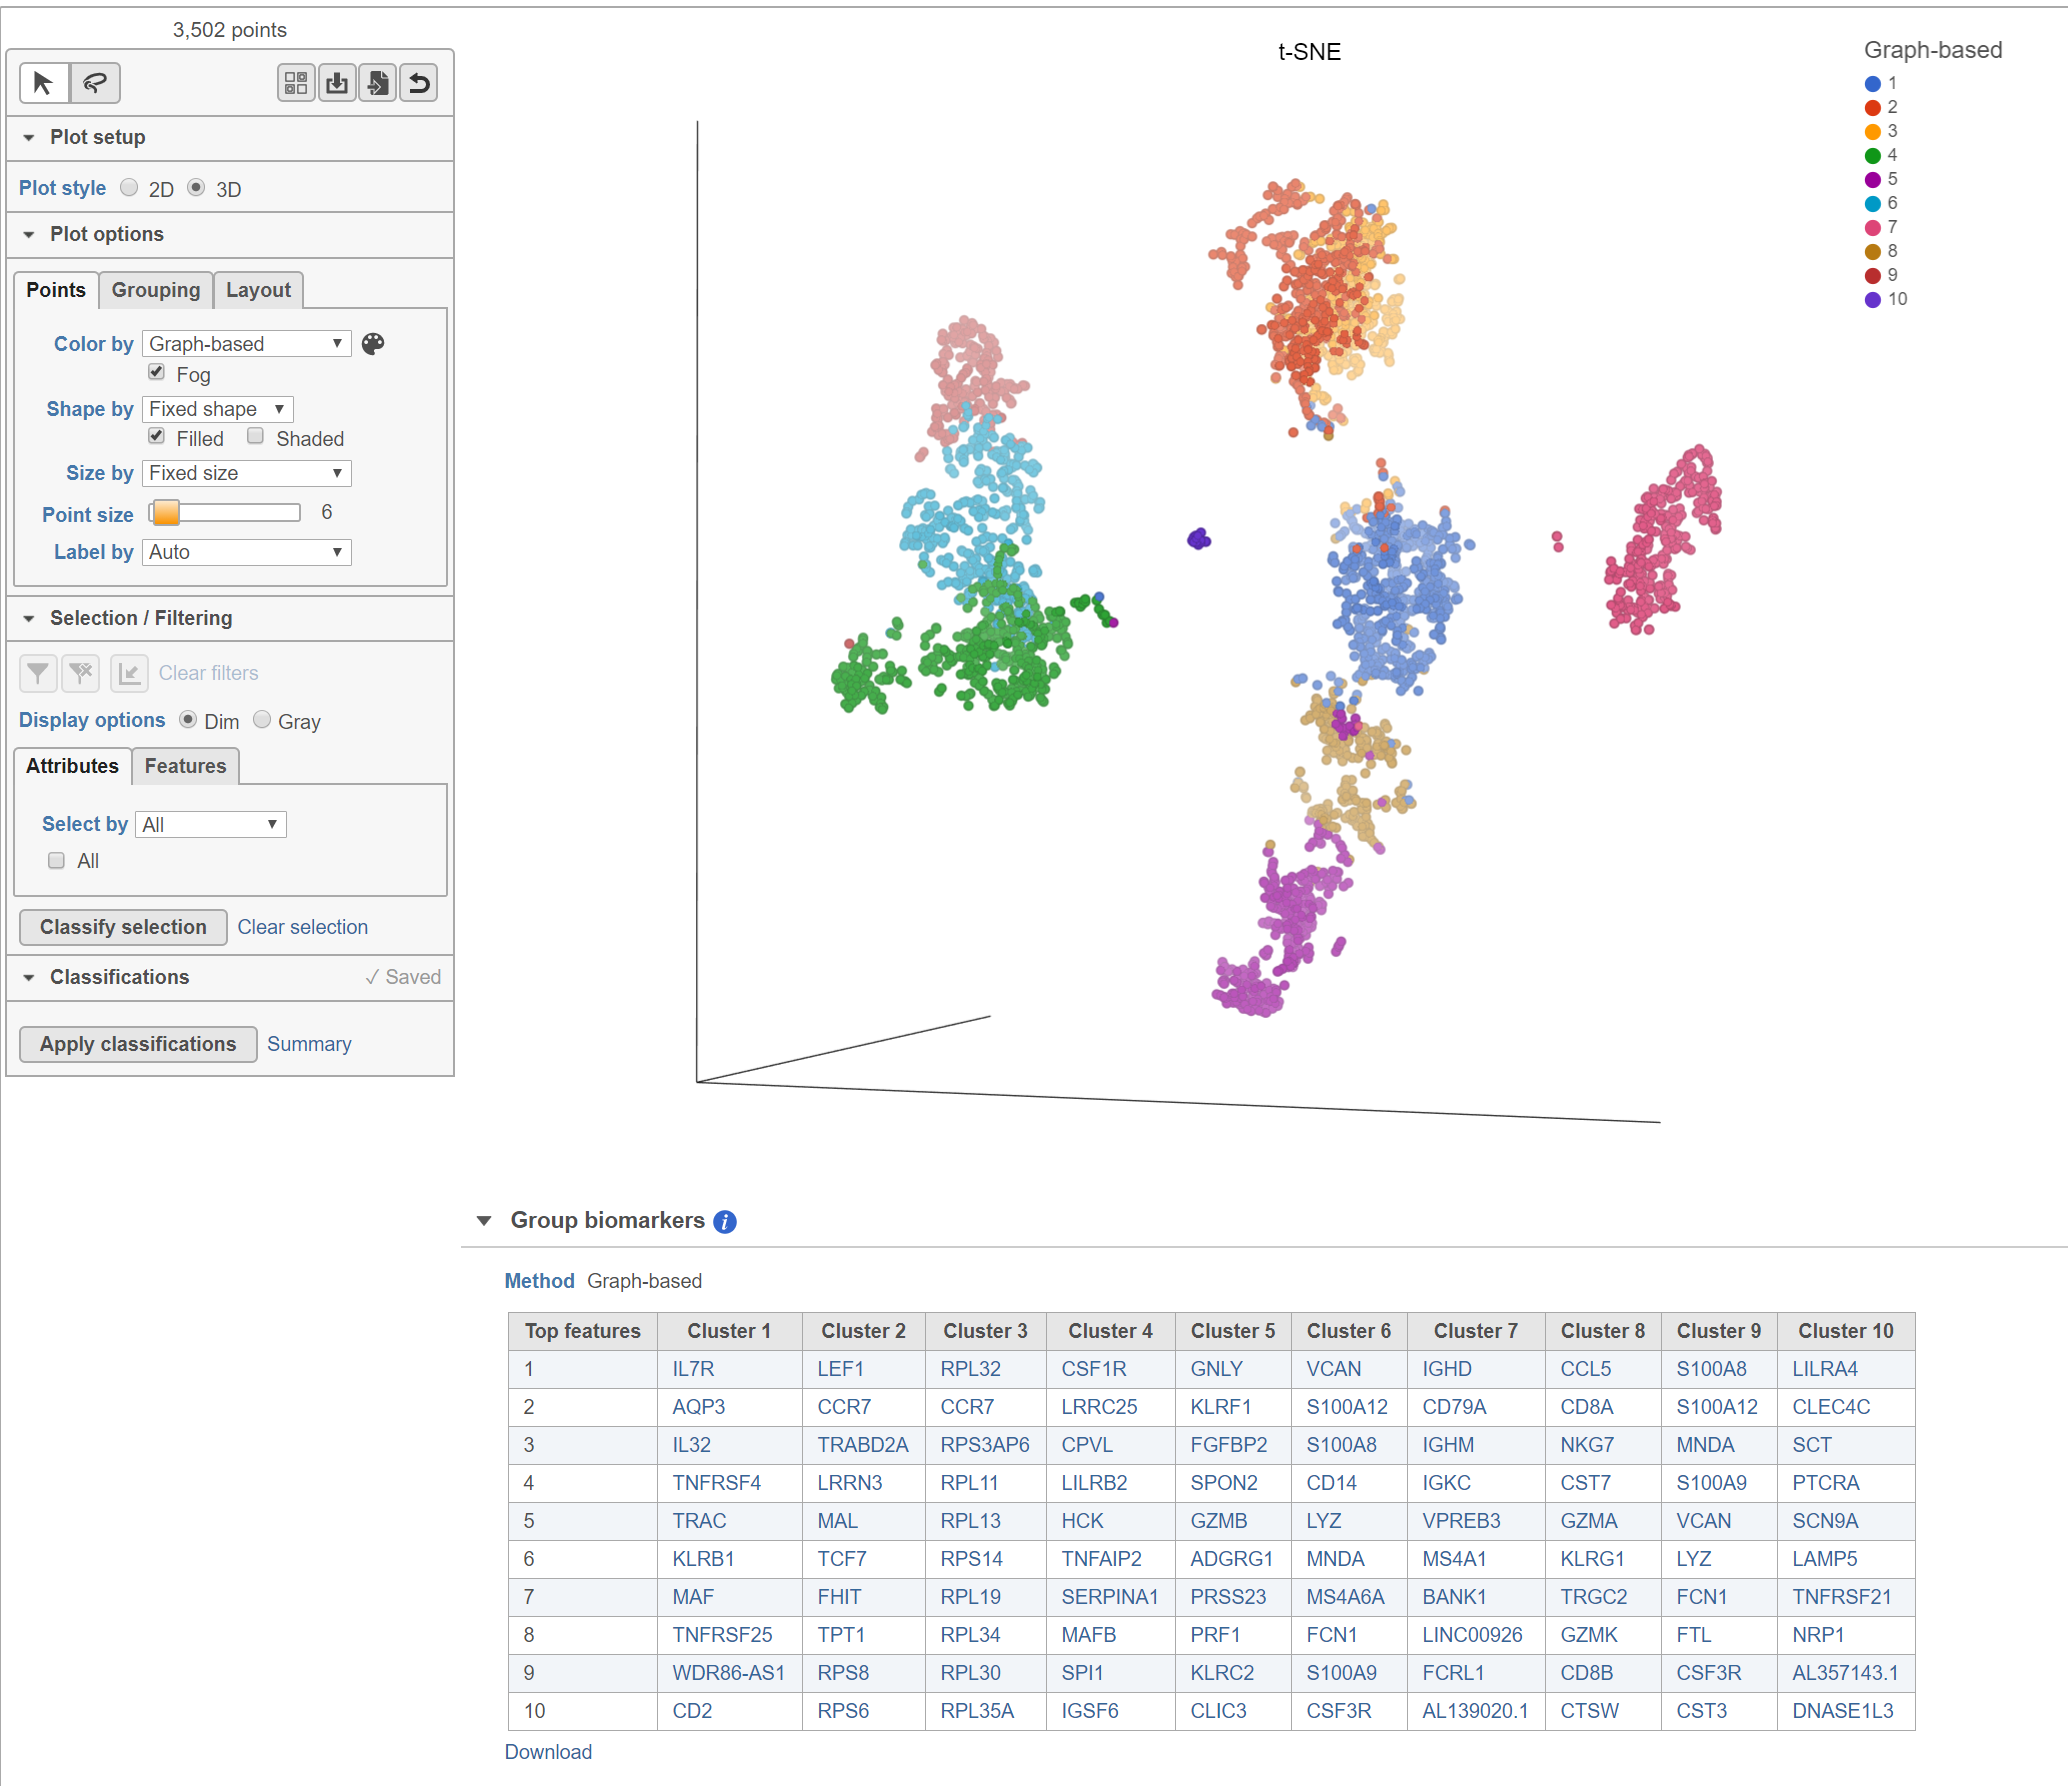
The Clustering result data node includes the input values for each gene and adds cluster assignment as a new attribute, Graph-based, for each observation. If the Clustering result data node is visualized by Scatter plot, PCA, t-SNE, or UMAP, the plot will be colored by the Graph-based attribute and the group biomarker table, if generated, will be included below the plot (Figure 2).
| Numbered figure captions | ||||
|---|---|---|---|---|
| ||||
|
Basic Graph-based clustering parameters
...
Overview
Content Tools