Page History
...
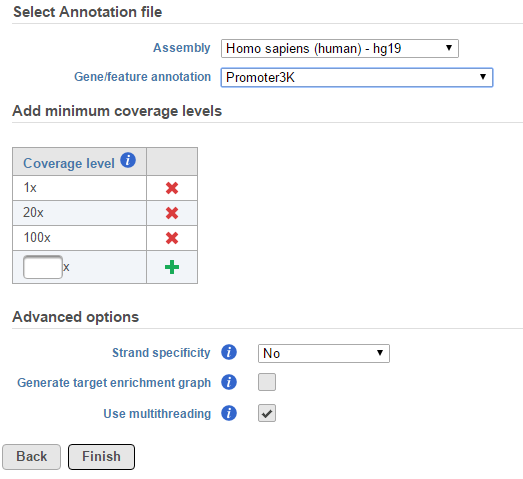
As for the Advanced options, if Strand-specificity is turned on, only reads which match the strand of a given region will be considered for that region’s coverage statistics.
Generate target enrichment graphs will generate a graphical overview of coverage across each feature.
When Use multithreading is checked, the computation will utilize multiple CPUs. However, if the input or output data is on some file systems like GPFS file system, which doesn't support well on multi-thread tasks, unchecking this option will prevent task failures.
| Numbered figure captions | ||||
|---|---|---|---|---|
| ||||
|
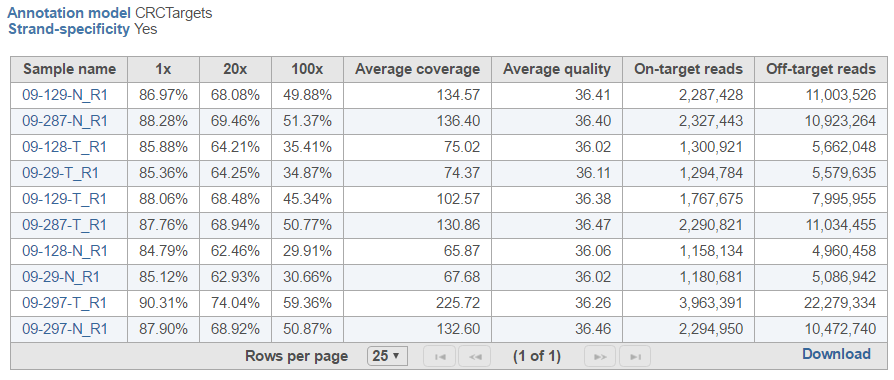
Coverage report result page contains project-level overview and starts with a summary table, with one sample per row (Figure 2). The first few columns show the percentage of bases in the genomic features which are covered at the specified level (or higher) (default: 1×, 20×, 100×). Average coverage is defined as the sum of base calls of each base in the genomic features divided by the length of the genomic features. Similarly, Average quality is defined as the sum of average quality of those bases that cover the genomic features, divided by the length of covered genomic features. The last two columns show the number of On-tarted reads (overlapping the genomic features) and Off-target reads (not overlapping the features). The Optional columns link enables import of any meta-data present in the data table (Data tab).
| Numbered figure captions | ||||
|---|---|---|---|---|
| ||||
|
...
Overview
Content Tools