Page History
...
- Click
 to view the Volcano plot
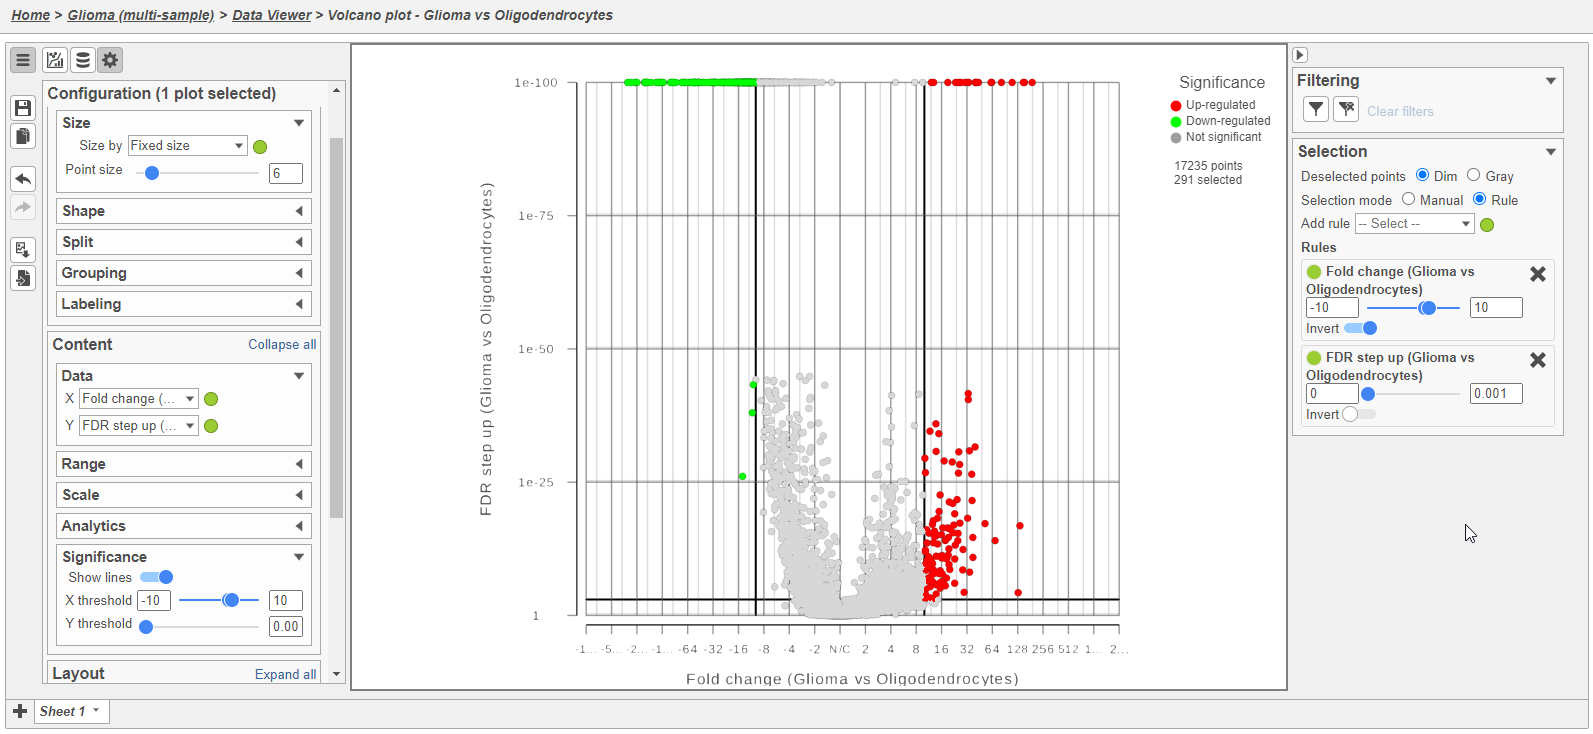
 - In the Configuration card Open the Style icon on the left, expand the Size card and increase the change Size point size to 6
- In Open the Configuration card Axes icon on the left , expand the Data card and change the Y-axis to FDR step up (Glioma vs Oligodendrocytes)
- In the Configuration card on the left, expand the Significance card and change Open the Statistics icon and change the Significance of X threshold to -10 and 10 and the Y threshold to 0.001
- In the Selection card on the rightOpen the Select & Filter icon, set the Fold change thresholds to -10 and 10
- In the Selection card on the right Select & Filter, click
 to remove the P-value (Glioma vs Oligodendrocytes) selection rule. From the drop-down list, add FDR step up (Glioma vs Oligodendrocytes) as a selection rule and set the maximum to 0.001
This gives 291 significant differentially expressed genes Note these changes in the icon settings and volcano plot below (Figure 6).
| Numbered figure captions | ||||
|---|---|---|---|---|
| ||||
|
We can now recreate these conditions in the GSA report filter.
...
Overview
Content Tools