Page History
...
| Numbered figure captions | ||||
|---|---|---|---|---|
| ||||
|
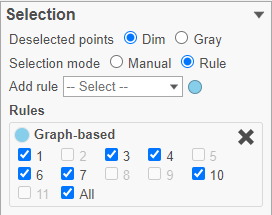
- In the Graph-based filtering rule, click All to deselect all cells
- Click cluster 6 to select all cells in cluster 6
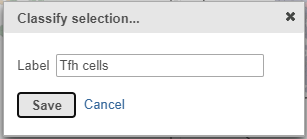
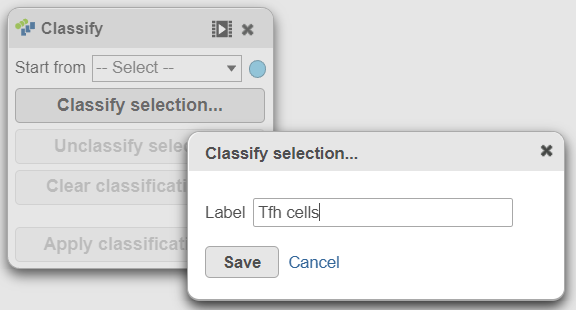
- In the Classification card on the rightUsing the Classify tool, click Classify selection
- Label the cells as Tfh cells (Figure 21)
- Click Save
...
| Numbered figure captions | ||||
|---|---|---|---|---|
| ||||
|
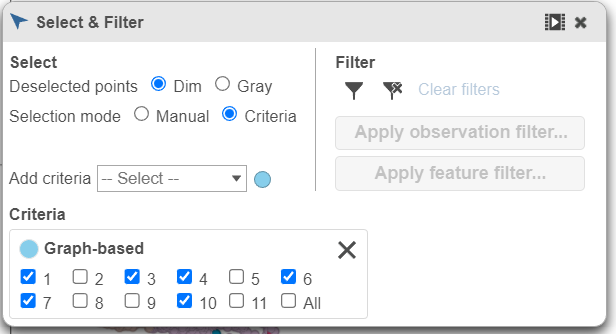
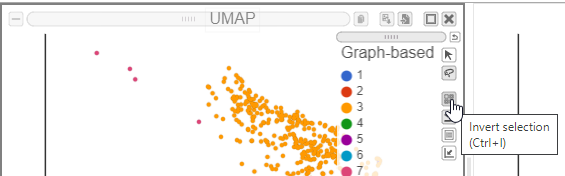
- Click
 in the Filtering card on the right to Select & Filter to exclude the cluster 6/Tfh cells
 - Click cluster 4 to select all cells in cluster 4
- In the Classification card on the rightthe Classify icon, click Classify selection
- Label the cells as Cytotoxic cells
- Click Save
- Click in the Filtering card on the right to Select & Filter to exclude the cluster 4/Cytotoxic cells
...
| Numbered figure captions | ||||
|---|---|---|---|---|
| ||||
|
- In the Classification card on the right Classify, click Classify selection
- Label the cells as Helper T cells
- Click Save
...
- Click the Clear filters link in the Filtering card on the right Select & Filter
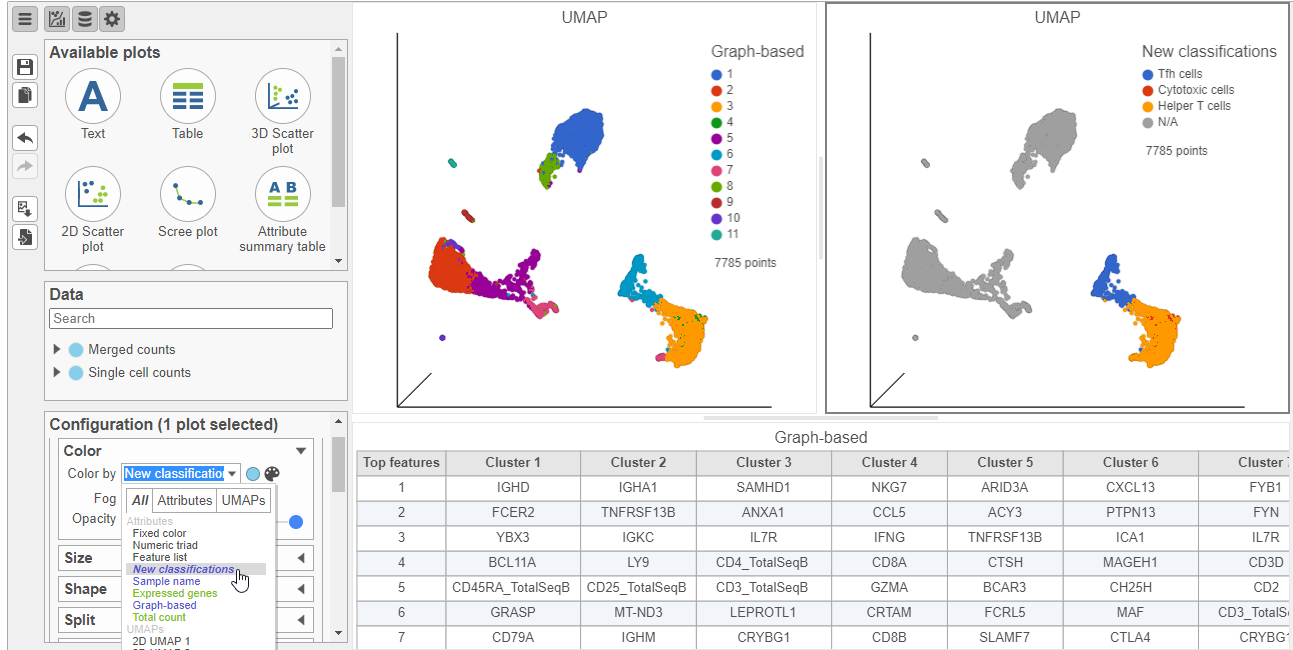
- Select the duplicate UMAP plot (with the cell colored by marker genes)
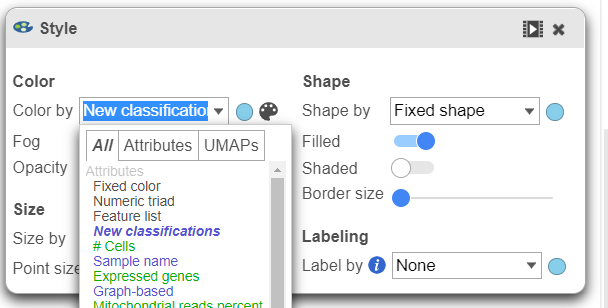
- In the Configuration card Under Configure on the left, expand the Color card open Style and color the cells by New classifications (Figure 23)
...
| Numbered figure captions | ||||
|---|---|---|---|---|
| ||||
|
B cells
In addition to T-cells, we would expect to see B lymphocytes, at least some of which are malignant, in a MALT tumor sample. We can color the plot by expression of a B cell marker to locate these cells on the UMAP plot.
...
Overview
Content Tools