Page History
...
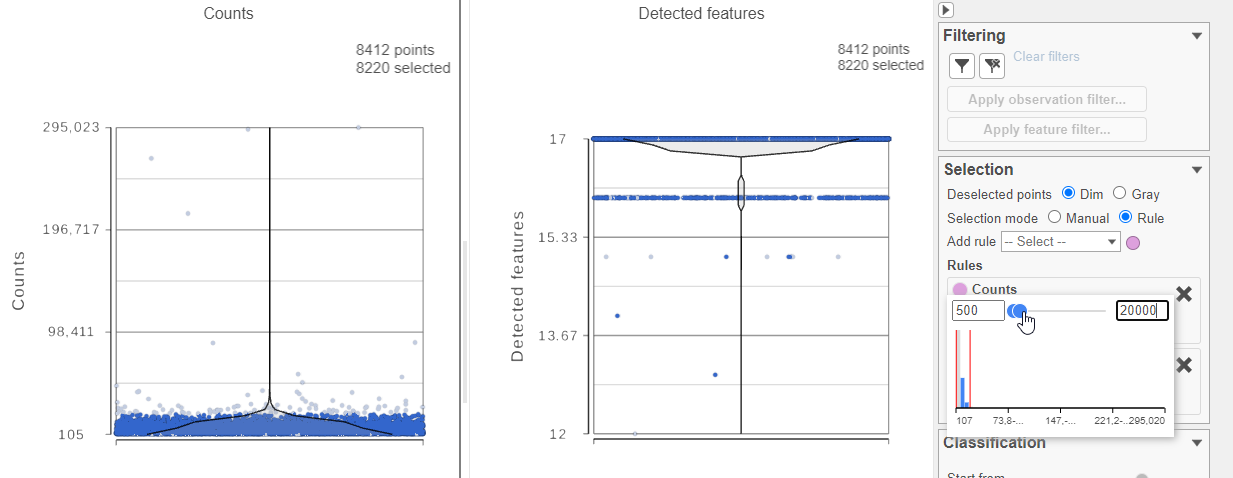
- Select one of the plots on the canvas
- In the Selection card Select & Filter icon on the rightleft under Tools, set the Counts threshold to keep cells between 500 and 20000 (Figure 4)
...
| Numbered figure captions | ||||
|---|---|---|---|---|
| ||||
|

- Click
 in the Filteringunder Filter card on the right
 - Click Apply observation filter...
- Select the Antibody Capture data node as input in the pipeline preview (Figure 5)
- Click Select
...
| Numbered figure captions | ||||
|---|---|---|---|---|
| ||||
|

- Click in the Filtering card Filter on the right
- Click Apply observations filter
- Select the Gene Expression data node as input in the pipeline preview
- Click Select
- Click OK to dismiss the message about the task being enqueued
- Click the project name at the top to go back to the Analyses tab
- Your browser may warn you that any unsaved changes to the data viewer session will be lost. Ignore this message and proceed to the Analyses tab
...
Overview
Content Tools