Page History
...
| Numbered figure captions | ||||
|---|---|---|---|---|
| ||||
|
Interactive KEGG pathway maps
When KEGG database is used, on the enrichment task report, when click on a pathway ID in the Gene set column, a KEGG pathway gene network picture is displayed (Figure 7)
| Numbered figure captions | ||||
|---|---|---|---|---|
| ||||
|

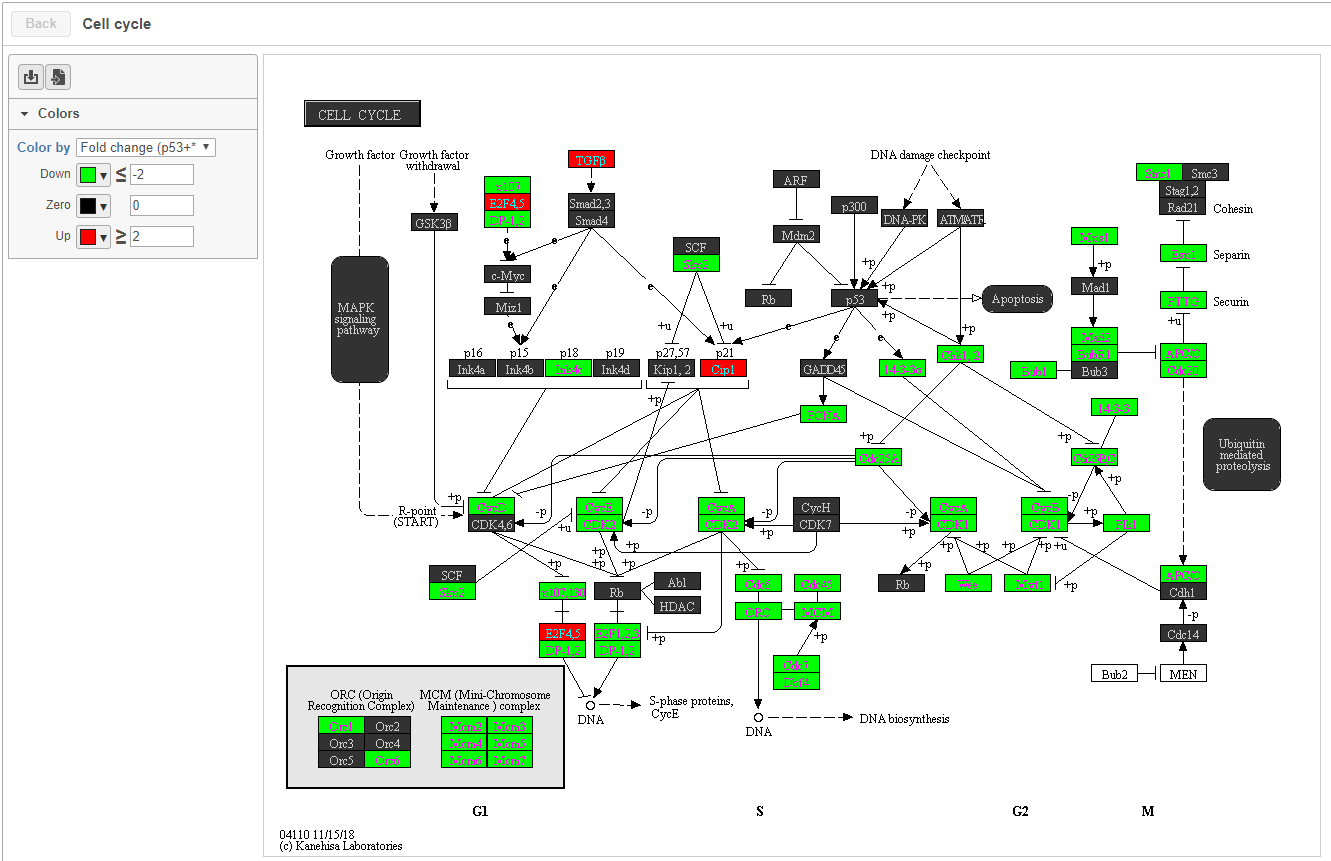
Each rectangle on the map represents a gene product in the pathway. Gene products are mostly proteins coded by a gene or group of genes, but they could be RNA too. Related pathways are shown as large rounded rectangles. Chemical compounds, DNA or other molecules are shown as circles.
...
| Numbered figure captions | ||||
|---|---|---|---|---|
| ||||
|

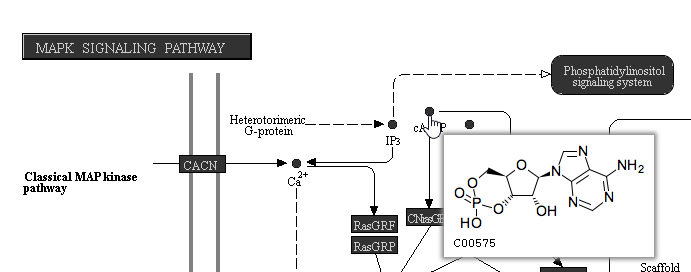
On KEGG pathway maps that include chemical compounds, the chemical structure is shown in the tooltip on mouse-over (Figure 10).
| Numbered figure captions | ||||
|---|---|---|---|---|
| ||||
|

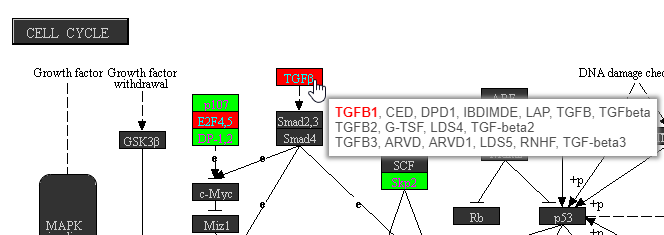
Clicking a rectangle opens the page for that gene or group of genes on the KEGG website in a new tab in your web browser.
...
Overview
Content Tools