Page History
...
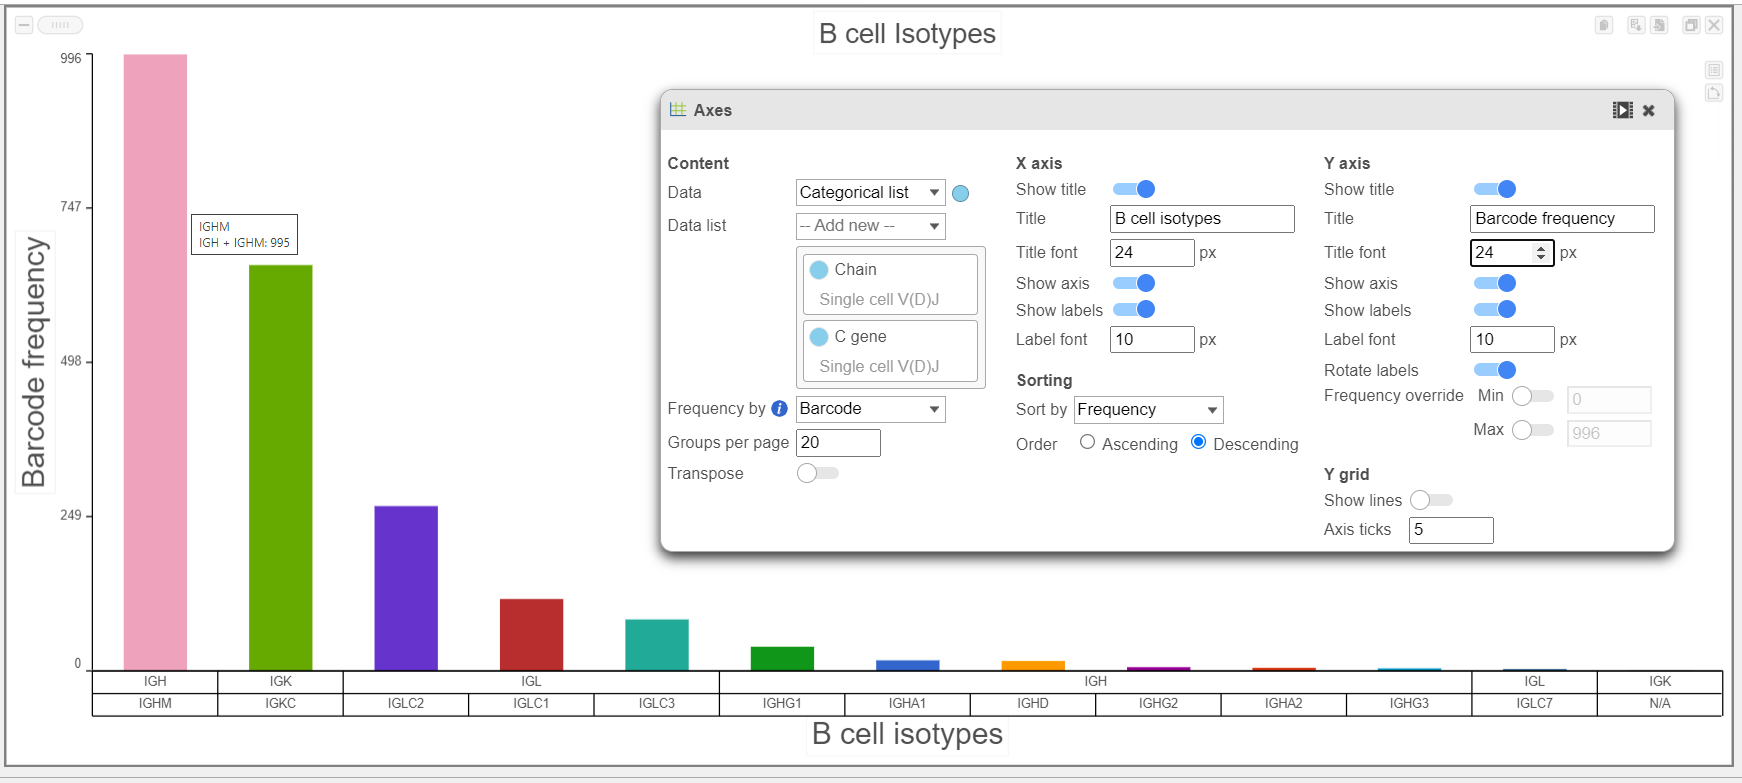
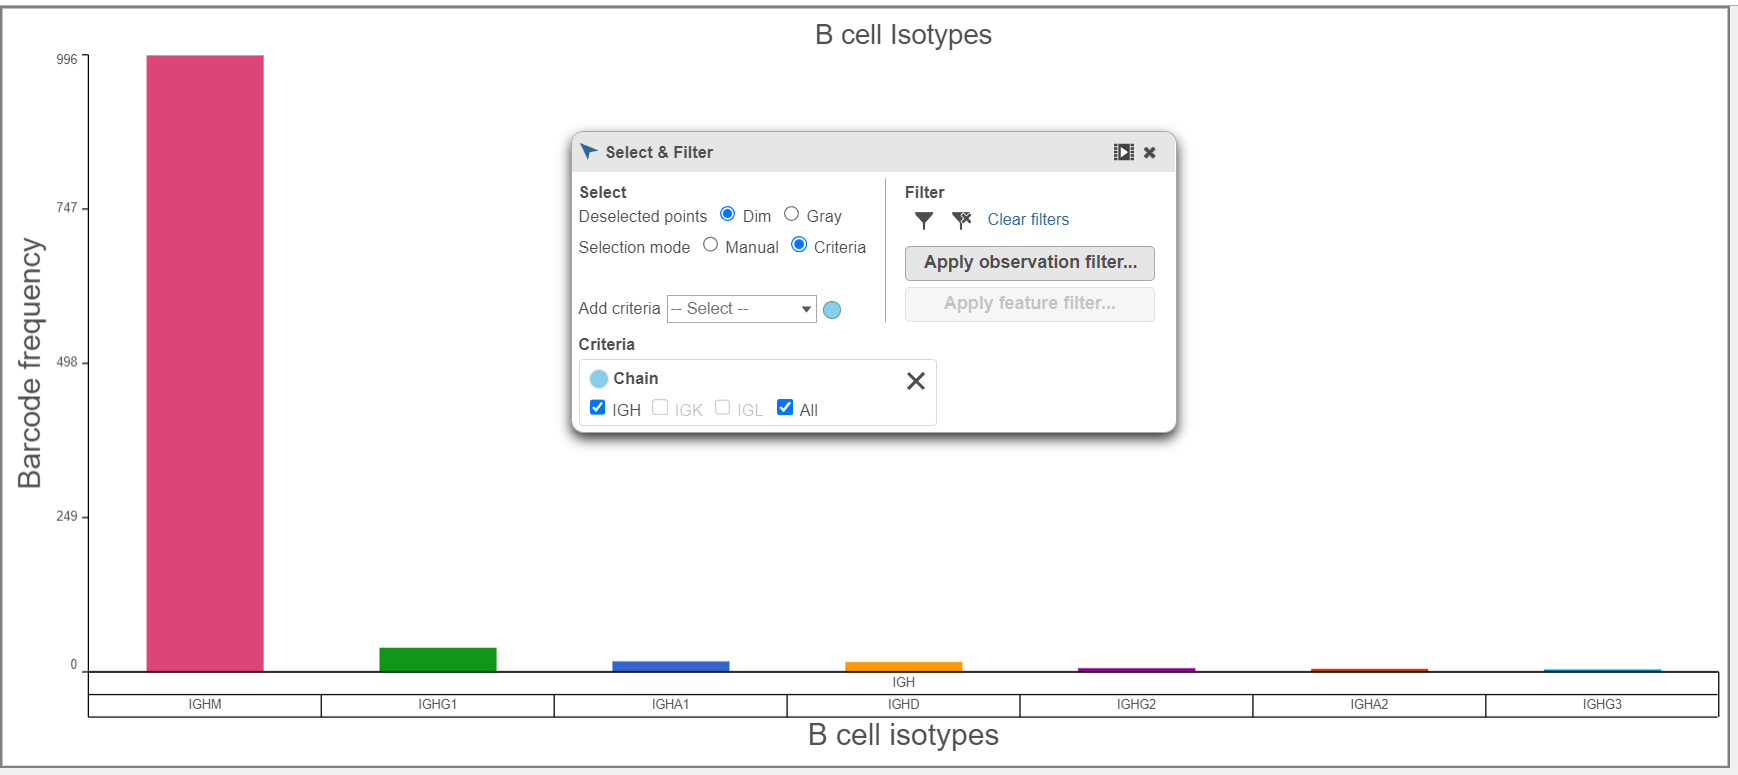
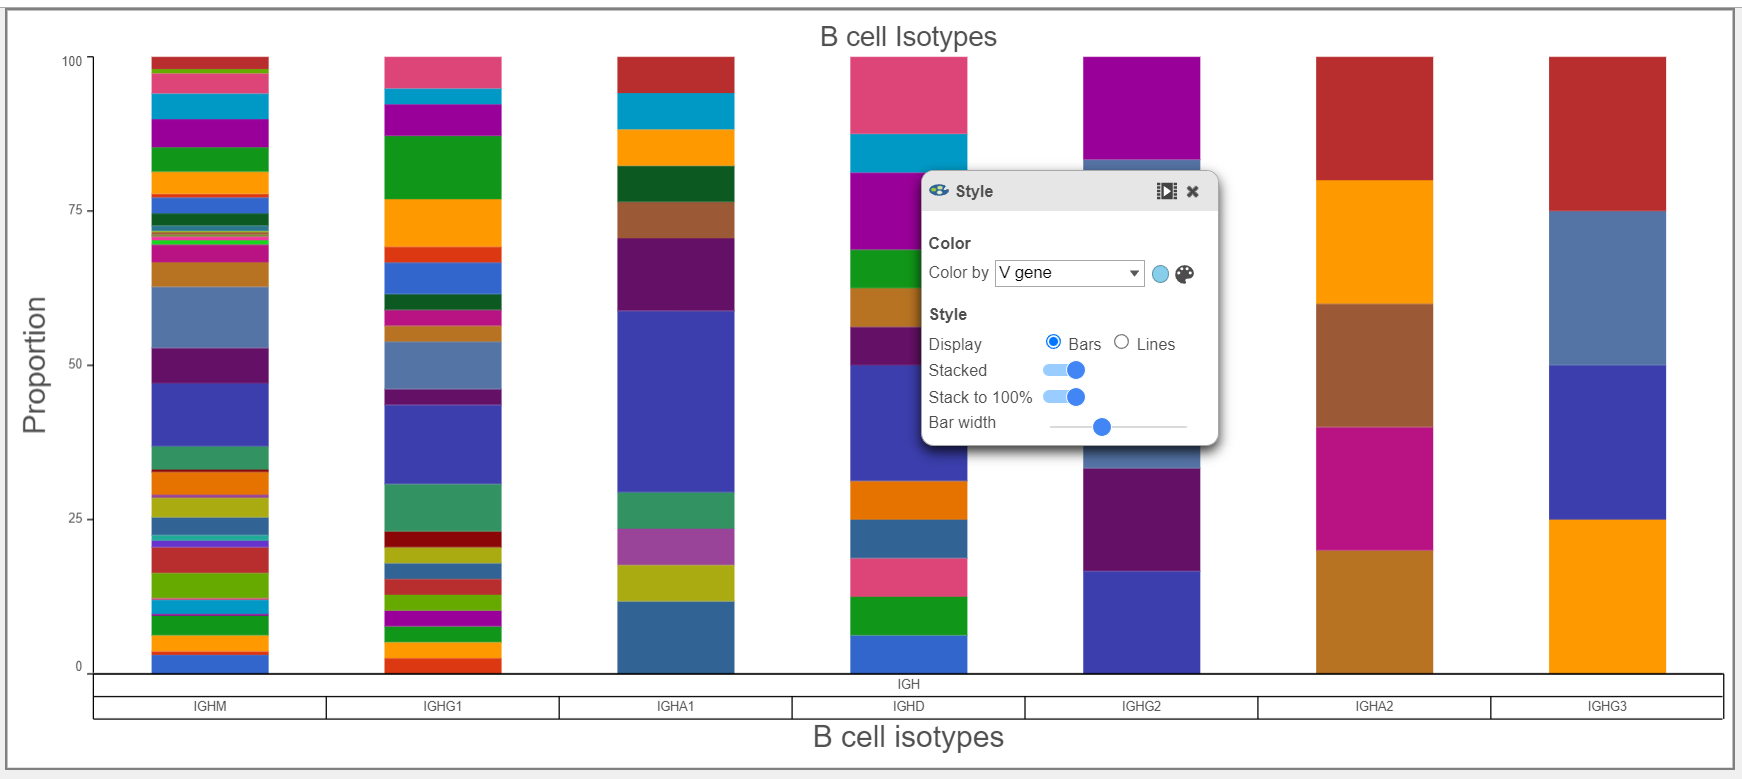
- B cell isotypes are defined by the Chain and C gene. In the examples below, Chain and C gene are plotted by Barcode frequency using a Bar chart. On the top, no selection and filtering has been performed. On the second plot, the data has been selected and filtered by the heavy chain. By using Select & filter, certain criteria can be focused on. The third plot is stacked to 100% and colored by V gene because the V regions do not change specificity during isotype switching.


...
Overview
Content Tools