Page History
...
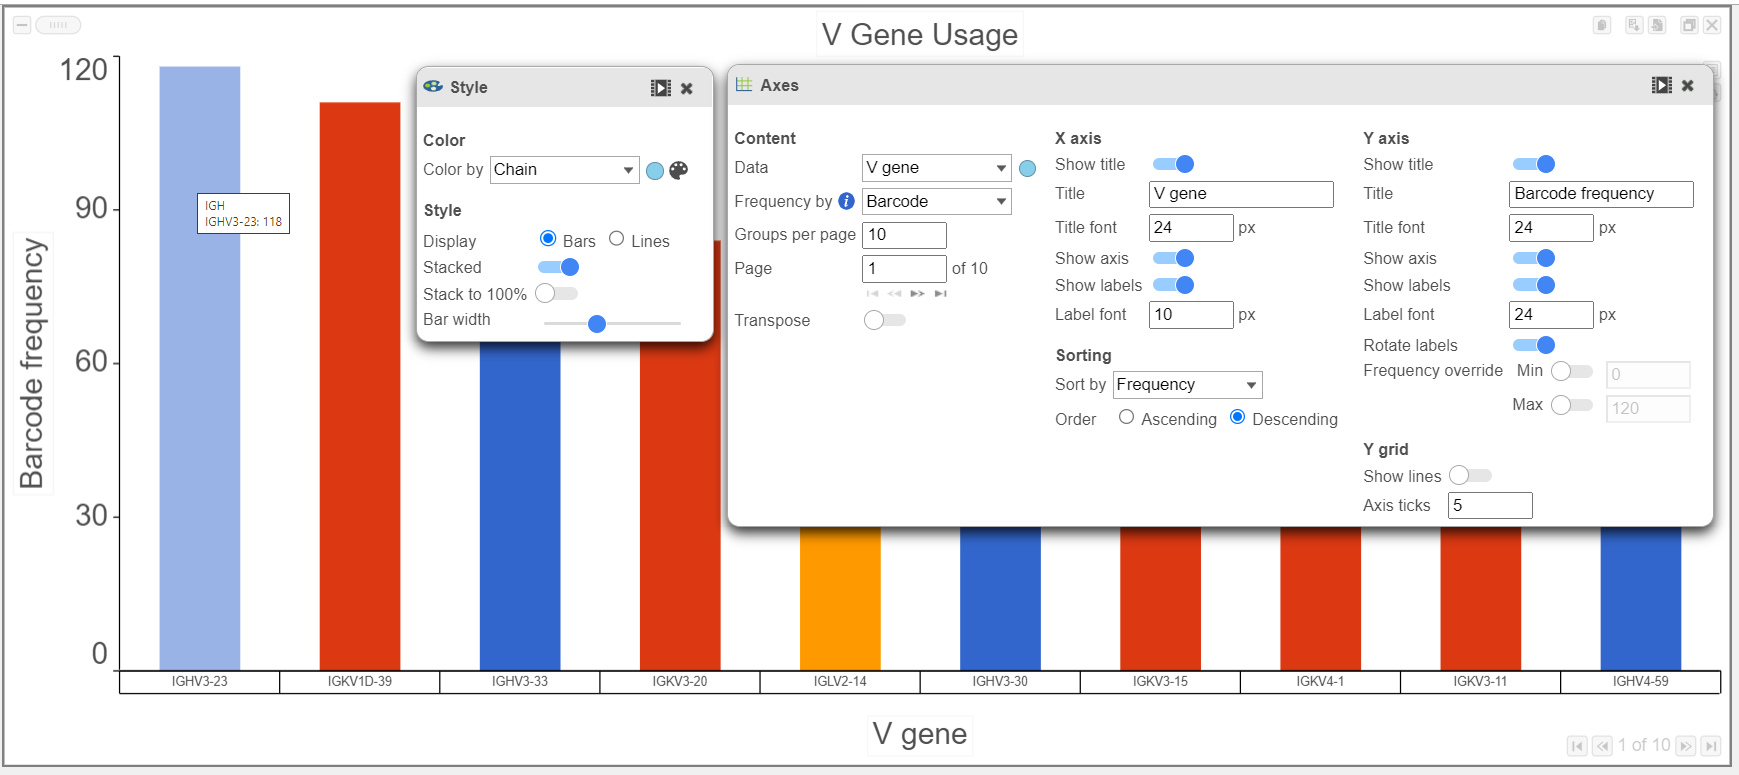
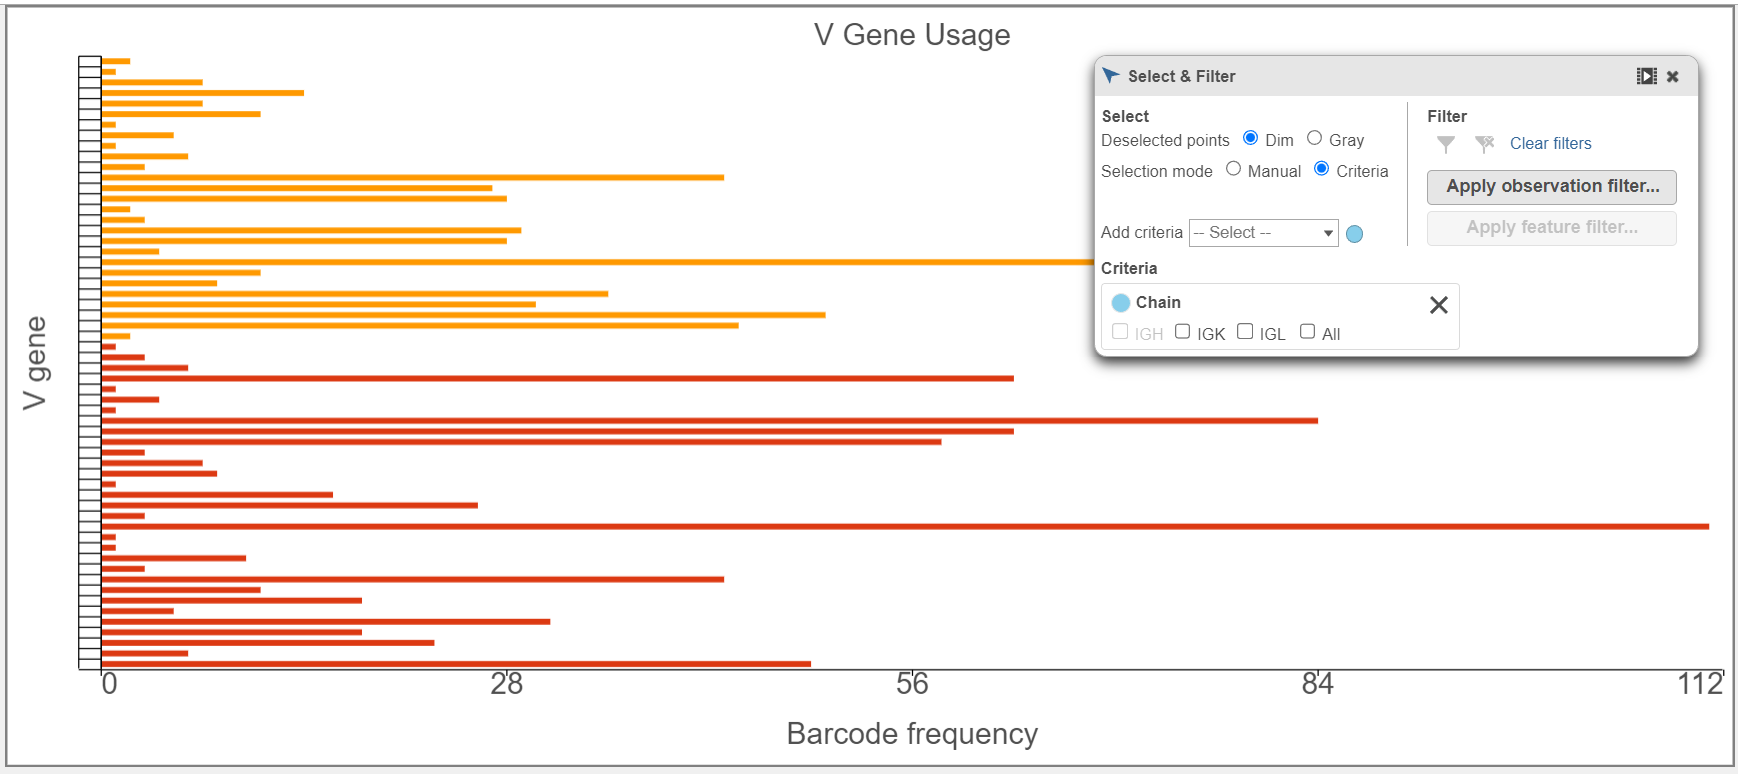
- Gene usage plots for the V, D, and J genes can be plotted many ways, as seen by the Bar chart examples below for the V gene. In the top plot, barcode frequency for V genes is sorted by frequency in descending order and colored by Chain. The transposed plot below shows all of the groups sorted by ascending value and the heavy chain has been excluded.


- In the example below, a Pie chart split by Chain is used to plot the V gene and J gene. This is another way to explore and visualize frequency.
...
Overview
Content Tools