Page History
...
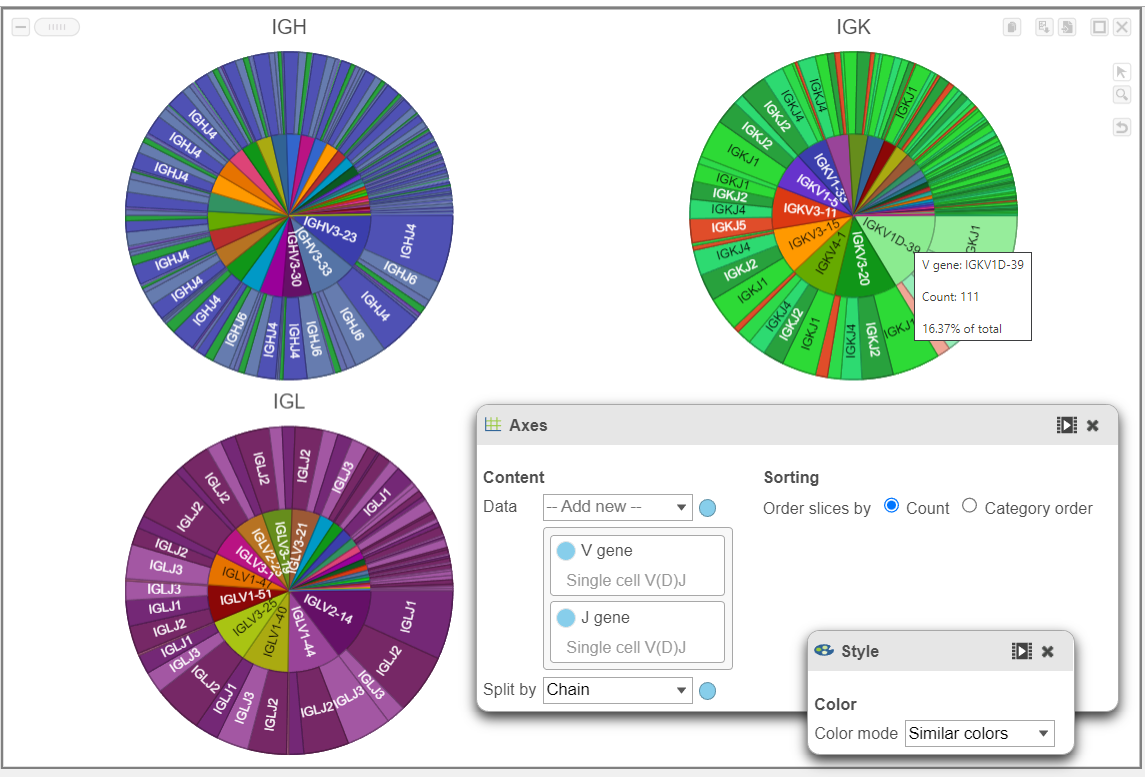
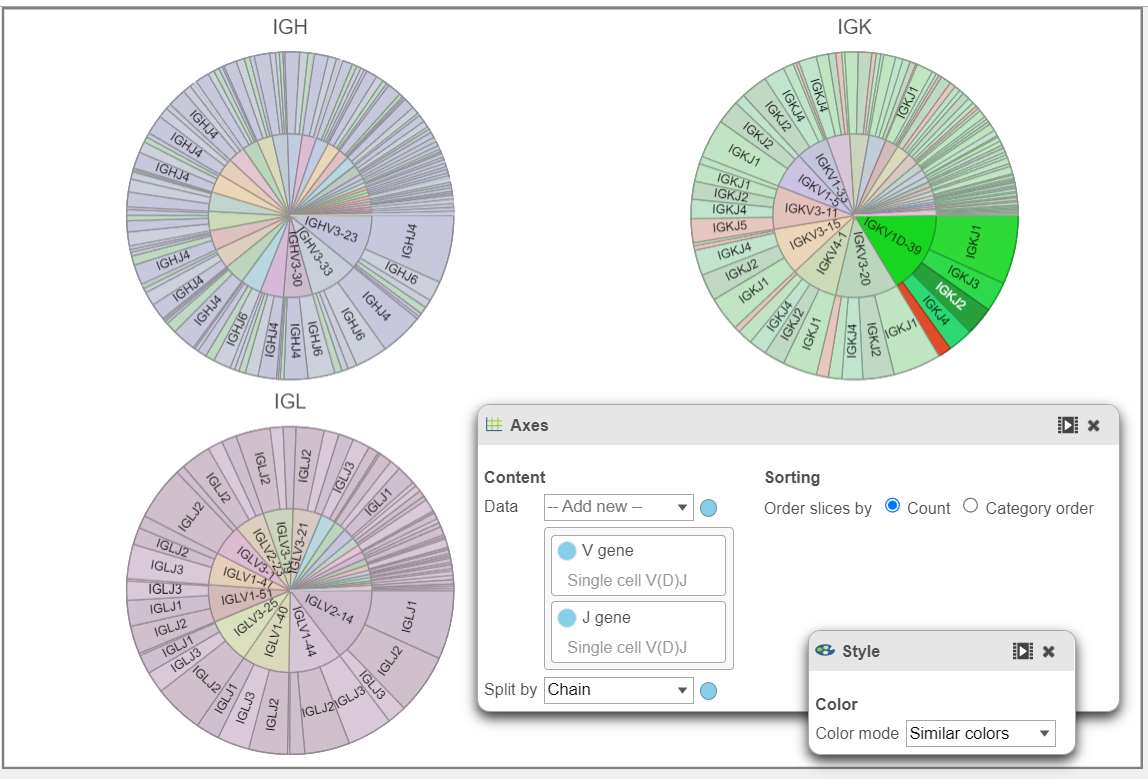
- In the example below, a Pie chart split by Chain is used to plot the V gene and J gene. This is another way to explore and visualize frequency.
References
- Tonegawa, S. Somatic generation of antibody diversity. Nature 302,575–581 (1983). https://doi.org/10.1038/302575a0
- https://support.10xgenomics.com/single-cell-vdj/software/pipelines/latest/output/annotation#contig-annotation
- https://support.10xgenomics.com/single-cell-vdj/software/overview/welcome
- https://support.10xgenomics.com/single-cell-gene-expression/software/pipelines/7.0/advanced/h5_matrices
- https://support.10xgenomics.com/single-cell-gene-expression/software/pipelines/7.0/output/matrices
- https://support.10xgenomics.com/single-cell-vdj/software/pipelines/latest/algorithms/annotation#productive
- https://support.10xgenomics.com/single-cell-vdj/software/pipelines/latest/using/vdj
- https://support.10xgenomics.com/single-cell-vdj/software/pipelines/latest/using/multi
Overview
Content Tools