Page History
...
- UMI (Unique Molecular Identifier): random 10 bp nucleotide sequence that distinguishes which reads came from the same transcript.
- Barcode: the unique identifier in each droplet which usually contains reads from a single cell.
- Contig: sequence of bases from the assembly that is comprised of reads with the same barcode and UMI which align to the same transcript6.
- Complementarity-Determining Region: CDR1, CDR2, and CDR3 are important in antigen binding of a T or B cell receptor.
- CDR3 (Complementarity-Determining Region 3): CDR3 spans the V(D)J junction. There is one CDR3 nucleotide sequence for each V(D)J contig.
- Clonotype: cells derived from a common ancestor during clonopoiesis which have a particular composition. The cells in a clonotype can have a different number of chains or different CDR3 regions but still be considered a single clone (CDR3 is a highly variable region used for binding; an example of different CDR3 regions would be from affinity maturation which can occur in memory B cells).
...
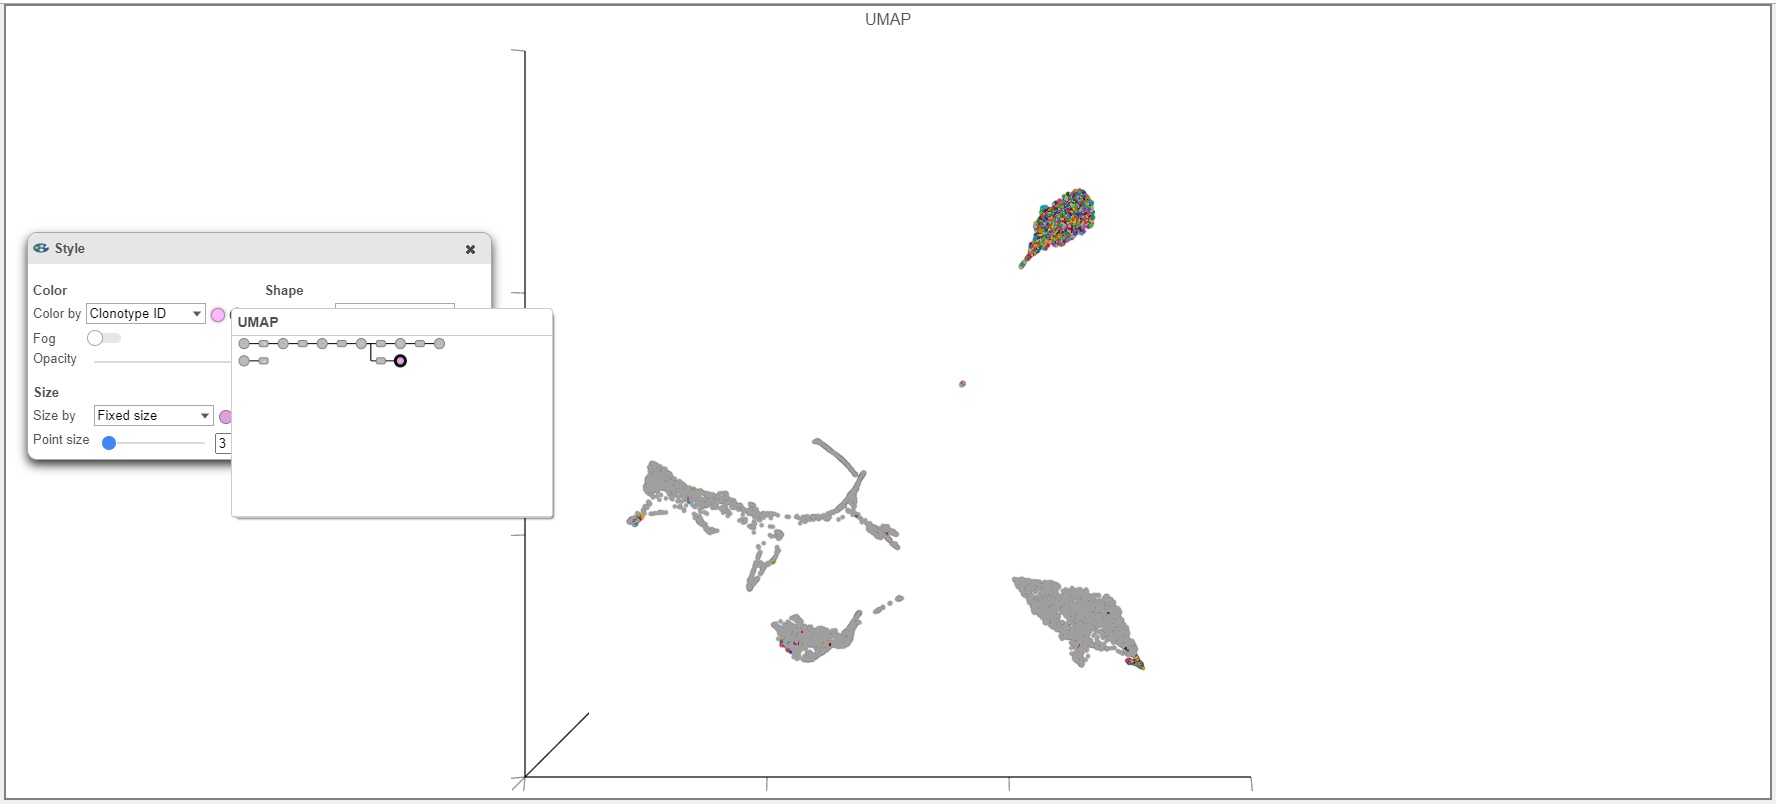
- When overlaying the Clonotype ID on plots from the Single cell counts analysis pipeline (such as the UMAP example below), make sure that you use the Clonotype ID from the Single cell counts node and not the VDJ node is used.
- B cell isotypes are defined by Chain and C gene. In the example below, Chain and C gene are plotted by Barcode frequency. On the left, no selection and filtering has been performed. On the plot on the right, the heavy chain has been selected and filtered by in the data. By using select & filter, criteria can be selected and focused on.


- In the left plot below, CDR3 abundance is plotted by barcode frequency and colored by Clonotype ID. In the example on the right, the plot is instead colored by Chain and other modifications have been made such as axis ticks and the number of groups per page. Note that the predicted CDR3 amino acid sequence is plotted here, but the predicted CDR3 nucleotide sequence (cdr3_nt) as well as information for other Complementarity-Determining Regions is also available.


References
- Tonegawa, S. Somatic generation of antibody diversity. Nature 302,575–581 (1983). https://doi.org/10.1038/302575a0
- https://support.10xgenomics.com/single-cell-vdj/software/pipelines/latest/output/annotation#contig-annotation
- https://support.10xgenomics.com/single-cell-vdj/software/overview/welcome
- https://support.10xgenomics.com/single-cell-gene-expression/software/pipelines/7.0/advanced/h5_matrices
- https://support.10xgenomics.com/single-cell-gene-expression/software/pipelines/7.0/output/matrices
- https://support.10xgenomics.com/single-cell-vdj/software/pipelines/latest/algorithms/annotation#productive
- https://support.10xgenomics.com/single-cell-vdj/software/pipelines/latest/using/vdj
- https://support.10xgenomics.com/single-cell-vdj/software/pipelines/latest/using/multi
Overview
Content Tools