Page History
...
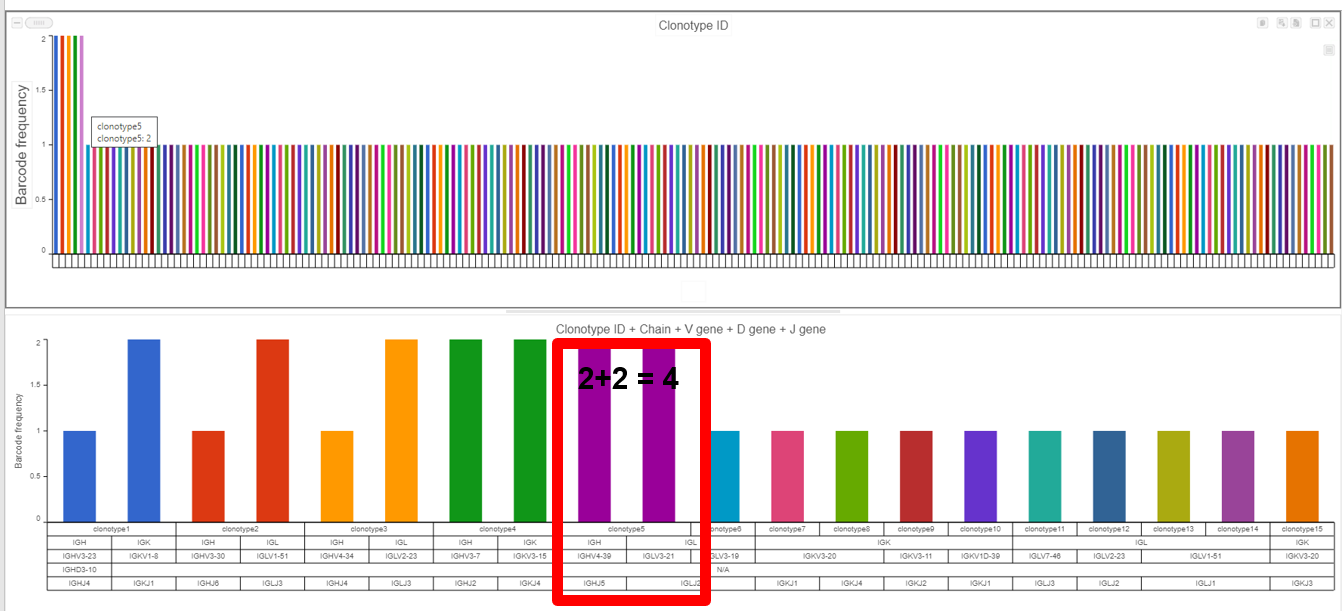
- The example below shows the results from the Clonotype Frequency Plot task which is accessed by choosing to perform this task from the Single cell V(D)J node then modified in the data viewer. In this case, the barcode frequency is the number of clonotypes per cell because the barcode usually represents a single cell, so there are 2 two cells which have clonotype 5 (purple bar with information from hovering) and clonotype 5 is made of two compositions (a frequency of 4 four for clonotype 5 from the V(D)J node) witnessed by the Chain, V gene, D gene, and J gene seen below the bars and by hovering.
...
Overview
Content Tools