Page History
...
Under Exploratory Analysis tasks is the Clonotype Frequency Plot task which will summarize the V(D)J node into plots of interest in the Data Viewer. Similar manual comparisons can be made in the Data Viewer. These may include determining the T cell receptor and B cell receptor chains that make up clonotypes in the samples, quantifying the clone diversity by frequency, comparing the immune repertoire between samples, and visualizing clones and gene expression data together on scatterplots like a UMAP.
- The example below shows the results from the Clonotype Frequency Plot task which is accessed by choosing to perform this task from the Single cell V(D)J node then modified in the data viewer. In this case, the barcode frequency
...
- is the
...
- number of clonotypes per cell because the barcode usually represents a single cell, so there are 2 cells which have clonotype 5 (purple bar with information from hovering) and
...
- clonotype 5
...
- is made of two compositions (a
...
- contig frequency of 4 for clonotype 5 from the V(D)J node).
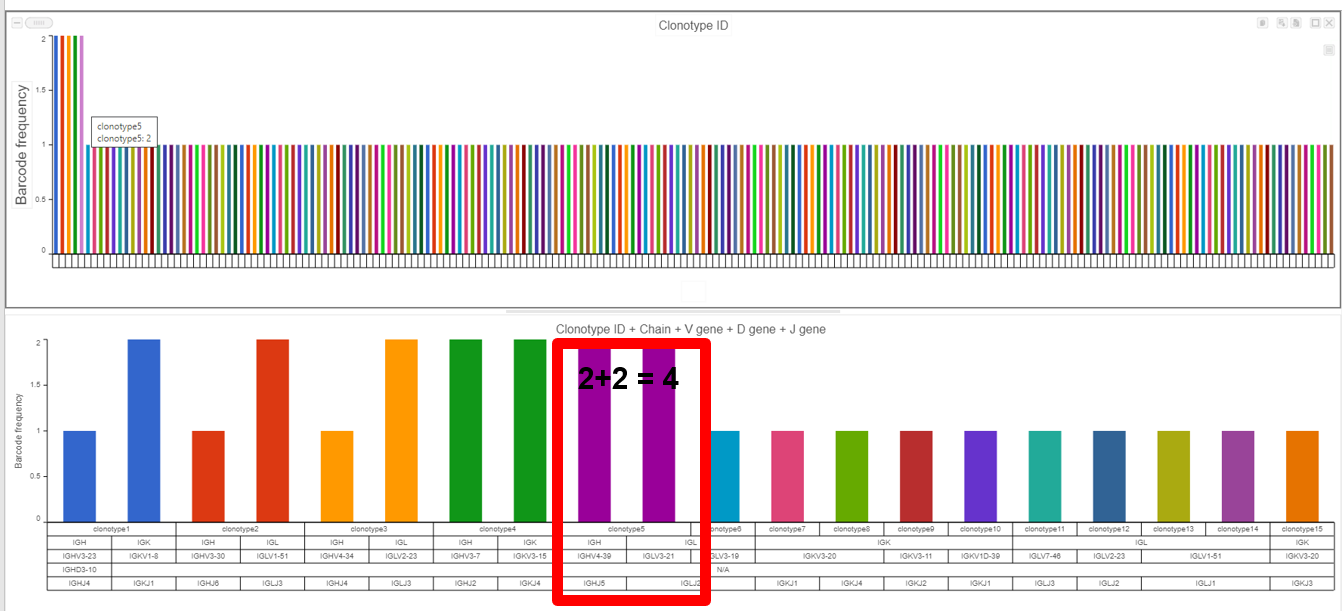
- Plotting clonotype frequency for the gene expression node and VDJ node, as seen below, highlights the difference between the two nodes.


References
- Tonegawa, S. Somatic generation of antibody diversity. Nature 302,575–581 (1983). https://doi.org/10.1038/302575a0
- https://support.10xgenomics.com/single-cell-vdj/software/pipelines/latest/output/annotation#contig-annotation
- https://support.10xgenomics.com/single-cell-vdj/software/overview/welcome
- https://support.10xgenomics.com/single-cell-gene-expression/software/pipelines/7.0/advanced/h5_matrices
- https://support.10xgenomics.com/single-cell-gene-expression/software/pipelines/7.0/output/matrices
- https://support.10xgenomics.com/single-cell-vdj/software/pipelines/latest/algorithms/annotation#productive
- https://support.10xgenomics.com/single-cell-vdj/software/pipelines/latest/using/vdj
- https://support.10xgenomics.com/single-cell-vdj/software/pipelines/latest/using/multi
Overview
Content Tools