Page History
...
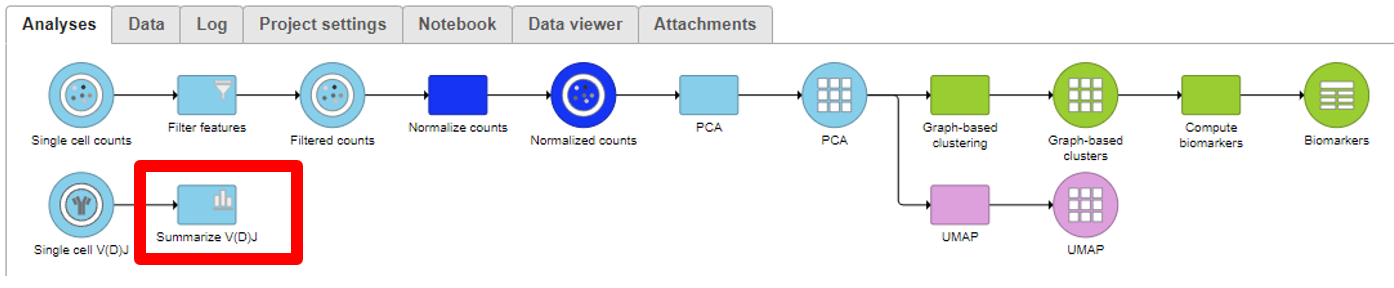
Clonotype Frequency Plot
Under Exploratory Analysis tasks is the Clonotype Frequency Plot task which will summarize the V(D)J node into plots of interest in the Data Viewer. Similar manual comparisons can be made in the Data Viewer. These may include determining the T cell receptor and B cell receptor chains that make up clonotypes in the samples, quantifying the clone diversity by frequency, comparing the immune repertoire between samples, and visualizing clones and gene expression data together on scatterplots like a UMAP.
References
- Tonegawa, S. Somatic generation of antibody diversity. Nature 302,575–581 (1983). https://doi.org/10.1038/302575a0
- https://support.10xgenomics.com/single-cell-vdj/software/pipelines/latest/output/annotation#contig-annotation
- https://support.10xgenomics.com/single-cell-vdj/software/overview/welcome
- https://support.10xgenomics.com/single-cell-gene-expression/software/pipelines/7.0/advanced/h5_matrices
- https://support.10xgenomics.com/single-cell-gene-expression/software/pipelines/7.0/output/matrices
- https://support.10xgenomics.com/single-cell-vdj/software/pipelines/latest/using/vdj
- https://support.10xgenomics.com/single-cell-vdj/software/pipelines/latest/using/multi
Overview
Content Tools