Join us for an event September 26!
How to Streamline RNA-Seq analysis and increase productivity—point, click, and done
Page History
...
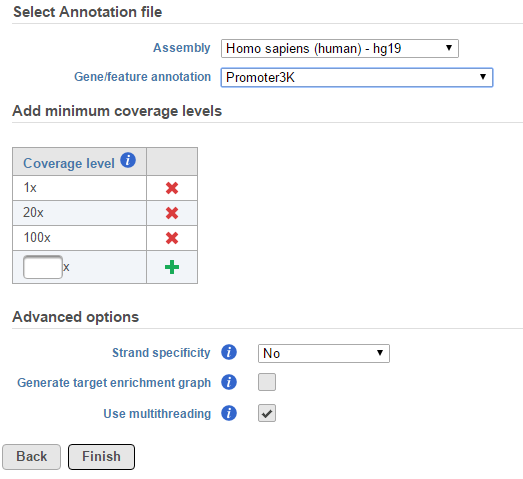
As for the Advanced options, if Strand-specificity is turned on, only reads which match the strand of a given region will be considered for that region’s coverage statistics. Generate target enrichment graphs will generate a graphical overview of coverage across each feature.
| Numbered figure captions | ||||
|---|---|---|---|---|
| ||||
|
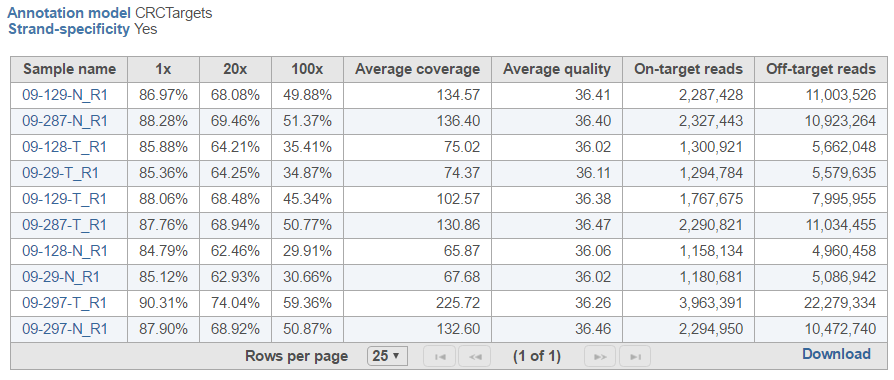
Coverage report result page contains project-level overview and starts with a summary table, with one sample per row (Figure 2). The first few columns show the percentage of bases in the genomic features which are covered at the specified level (or higher) (default: 1×, 20×, 100×). Average coverage is defined as the sum of base calls of each base in the genomic features divided by the length of the genomic features. Similarly, Average quality is defined as the sum of average quality of those bases that cover the genomic features, divided by the length of covered genomic features. The last two columns show the number of On-tarted reads (overlapping the genomic features) and Off-target reads (not overlapping the features).
| Numbered figure captions | ||||
|---|---|---|---|---|
| ||||
|
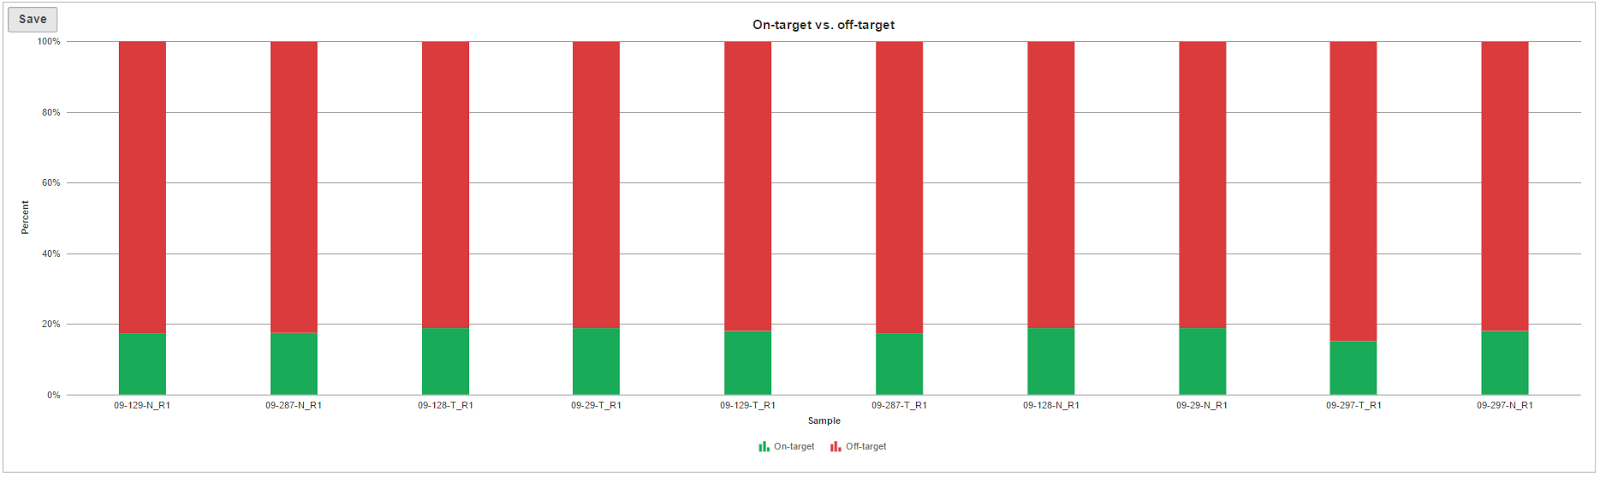
Quantification of on- and off-target reads is also displayed in the column chart below the table (Figure 3), showing each sample as a separate column and fraction of on-/off-target reads on the y-axis.
| Numbered figure captions | ||||
|---|---|---|---|---|
| ||||
|
Region coverage summary hyperlink opens a new page, with a table showing average coverage for each region (rows), across the samples (columns) (Figure 4).
| Numbered figure captions | ||||
|---|---|---|---|---|
| ||||
|
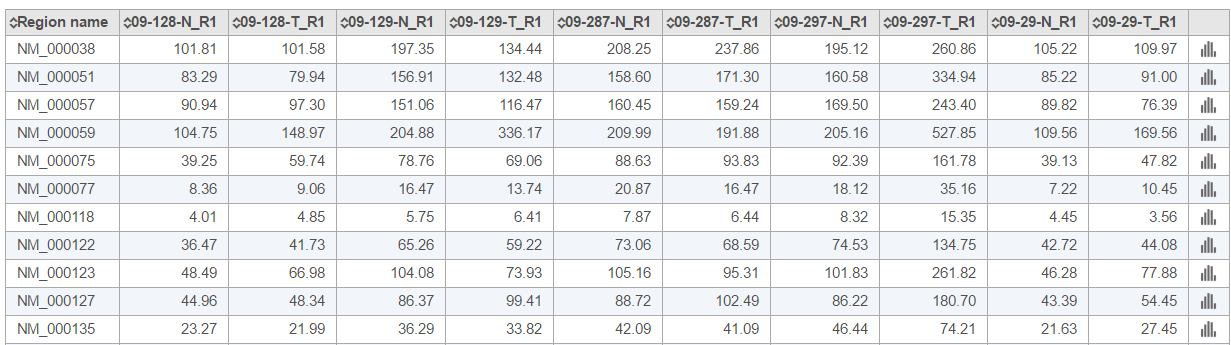
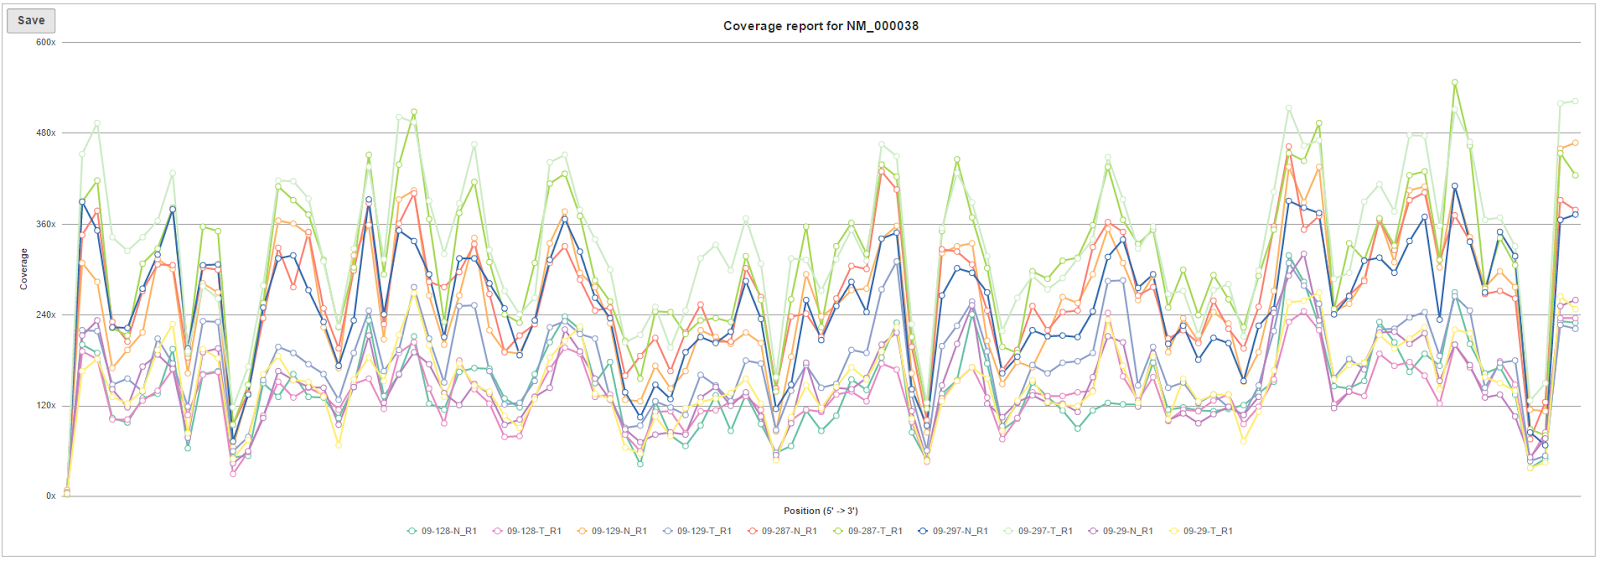
The browser icon in the right-most column (![]() ) of the Region average coverage summary table opens the Coverage graph for the respective region (Figure 5). The horizontal axis is the normalized position within the genomic feature, represented as 1st to 100th percentile of the length of the feature. The vertical axis is coverage. Each line on the plot is a single sample, and the samples are listed below the plot.
) of the Region average coverage summary table opens the Coverage graph for the respective region (Figure 5). The horizontal axis is the normalized position within the genomic feature, represented as 1st to 100th percentile of the length of the feature. The vertical axis is coverage. Each line on the plot is a single sample, and the samples are listed below the plot.
| Numbered figure captions | ||||
|---|---|---|---|---|
| ||||
|
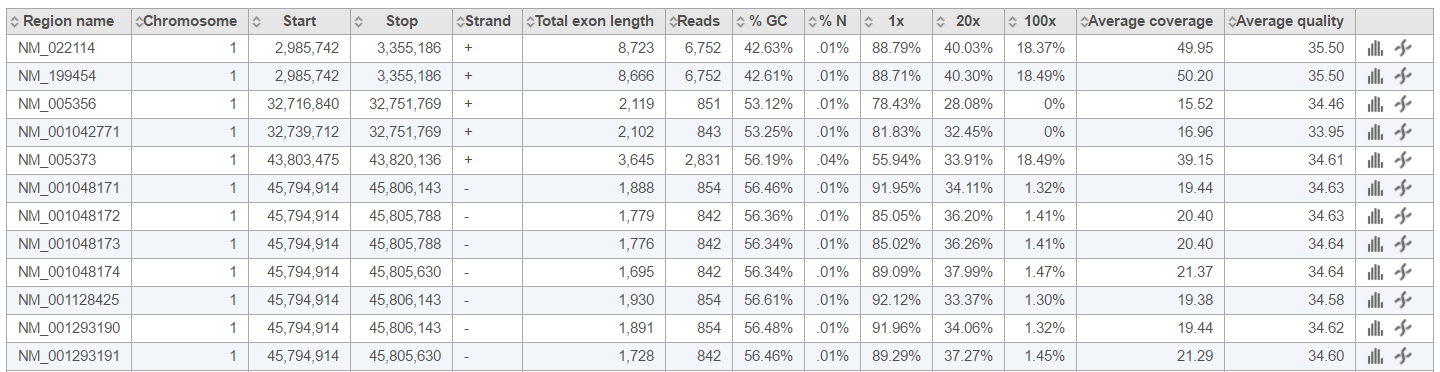
If you need more details about a sample, click on the sample name in the Coverage report table (Figure 6). The columns are as follows:
Region name: the genomic feature identifier (as specified in the annotation file)
Chromosome: the chromosome of the genomic feature (or region)
Start: the start position of the genomic feature (1-based)
Stop: the stop position of the genomic feature (2-based, which means the stop position is exclusive)
Strand: the strand of the genomic feature
Total exon length: the length of the genomic feature
Reads: the total number of reads aligning to the genomic feature
% GC: the percentage of GC contents of those reads aligning to the genomic feature
% N: the percentage of ambiguous bases (N) of those reads aligning to the genomic feature
(n)x: the proportion of the genomic feature which is covered by at least n number of alignments. [Note: n is the coverage level that you specified when submitting Coverage report task, defaults are 1×, 20×, 100×]
Average coverage: the average sequencing depth across all bases in the genomic feature
Average quality: the average quality score across covered bases in the genomic feature
 : the invokes the Coverage graph across the genomic feature, showing the current sample only (Figure 23) (or mouse over to get a preview of the plot)
: the invokes the Chromosome view and browses to the genomic location
| Numbered figure captions | ||||
|---|---|---|---|---|
| ||||
|
| Additional assistance |
|---|
|
| Page Turner | ||
|---|---|---|
|
| Rate Macro | ||
|---|---|---|
|
Overview
Content Tools