Page History
...
| Numbered figure captions | ||||
|---|---|---|---|---|
| ||||
|
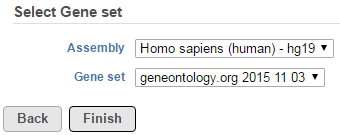
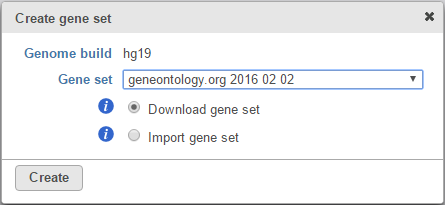
Then select the gene set you want to use (Figure 2). The files available for the current Genome build are listed under the Gene set drop-down list. Click the Finish button to start the analysis.
...
| Numbered figure captions | ||||
|---|---|---|---|---|
| ||||
|
By default, the groups are defined by Gene Ontology (GO), a bioinformatics initiative to unify the representation of gene and gene product attributes across various species [1, 2]. There are three main GO groups which are further divided into subgroups:
...
| Numbered figure captions | ||||
|---|---|---|---|---|
| ||||
|
The result is stored under an Enrichment task node. To open it, double click on the node or select the respective Task report from the context sensitive menu.
Figure 4 shows an example GO enrichment report. The table contains one GO category per row (Gene set column; the column entries are hyperlinks), with the category name in the Description column. The categories are ranked by the Enrichment score, which is the negative natural logarithm of the enrichment p-value (P-value column) derived from Fisher's exact test on the underlying contingency table. The higher the enrichment score, the more overrepresented the GO category is within the input list of significant genes. The columns can be searched by typing in the search term in the respective box (and hitting Enter), or sorted by selecting the double arrow icon (
![]() ).
).
| Numbered figure captions | ||||
|---|---|---|---|---|
| ||||
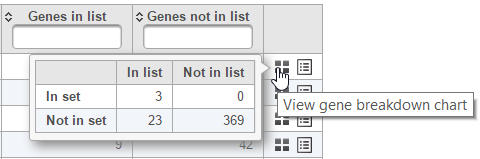
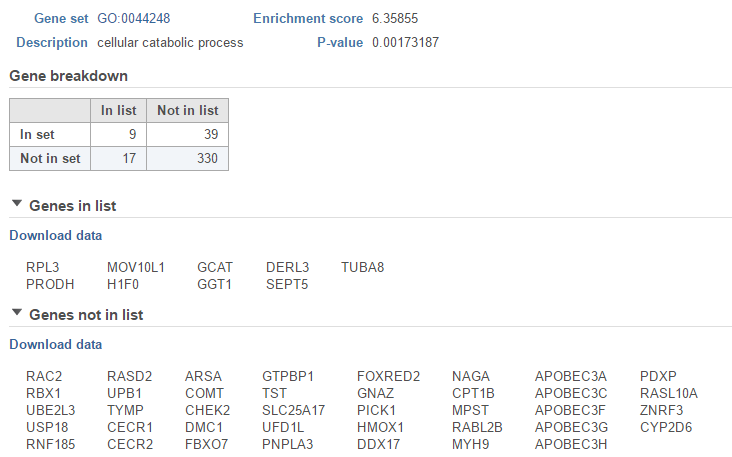
The contingency table (Figure 5) can be displayed by selecting the View gene breakdown chart icon on the right (![]() ). The term "list" refers to the list of significant genes, while the term "set" refers to the respective GO category. The first row of the contingency table is also seen in the report, namely the Genes in list and Genes not in list columns.
). The term "list" refers to the list of significant genes, while the term "set" refers to the respective GO category. The first row of the contingency table is also seen in the report, namely the Genes in list and Genes not in list columns.
...
| Numbered figure captions | ||||
|---|---|---|---|---|
| ||||
|
The View extra details (![]() ) button provides additional information on the GO category (Figure 6). In addition to the details already given in the report, a full list of Genes in list and Genes not in list can be inspected and downloaded (Download data) to the local computer as a text file.
) button provides additional information on the GO category (Figure 6). In addition to the details already given in the report, a full list of Genes in list and Genes not in list can be inspected and downloaded (Download data) to the local computer as a text file.
...
| Numbered figure captions | ||||
|---|---|---|---|---|
| ||||
|
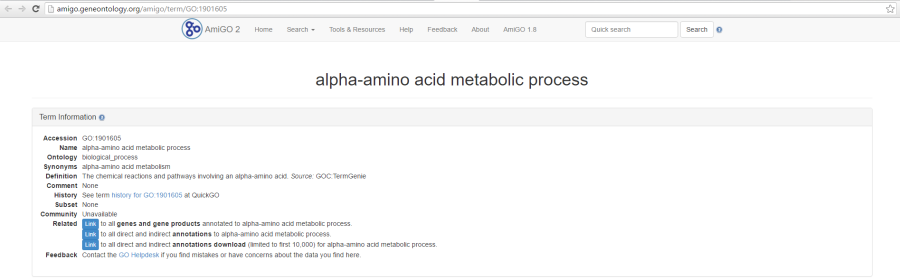
As previously mentioned, GO identifiers in the first column are hyperlinks to the Gene Ontology web-site entries (an example shown in Figure 7).
| Numbered figure captions | ||||
|---|---|---|---|---|
| ||||
|
References
- Ashburner M, Ball CA, Blake JA et al. Gene Ontology: tool for the unification of biology. Nat Genetics. 2000; 25:25-29.
- The Gene Ontology Consortium. Gene Ontology Consortium: going forward. Nucleic Acids Res. 2015; 43:D1049-1056.Recommended citations from the Geneontology.org website
...
Overview
Content Tools