Page History
...
| Numbered figure captions | ||||
|---|---|---|---|---|
| ||||
|
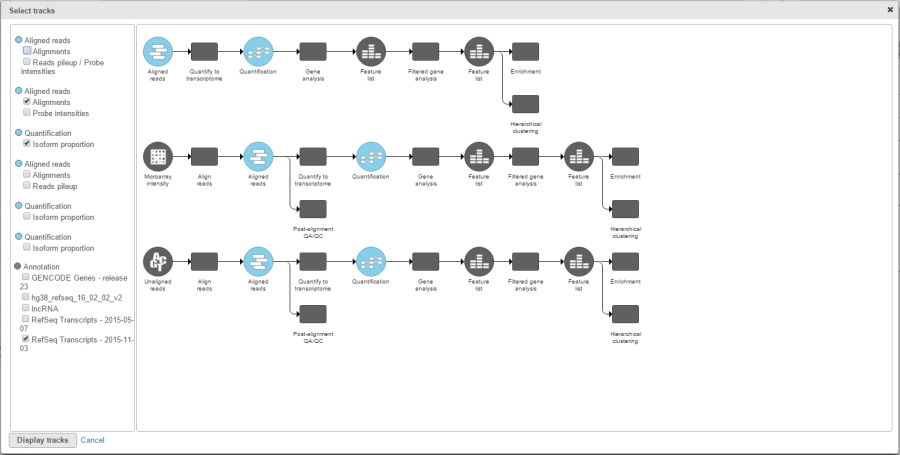
For the ease of use, the pipeline and the list of tracks are linked: hovering over the track list highlights the matching data node in the pipeline and vice versa, i.e. selecting a data node in the pipeline panel highlights the respective node in the track list (Figure 3). Once you decided on the tracks that should be plotted, push Display tracks to depict them on the canvas.
...
Overview
Content Tools