Page History
...
| Numbered figure captions | ||||
|---|---|---|---|---|
| ||||
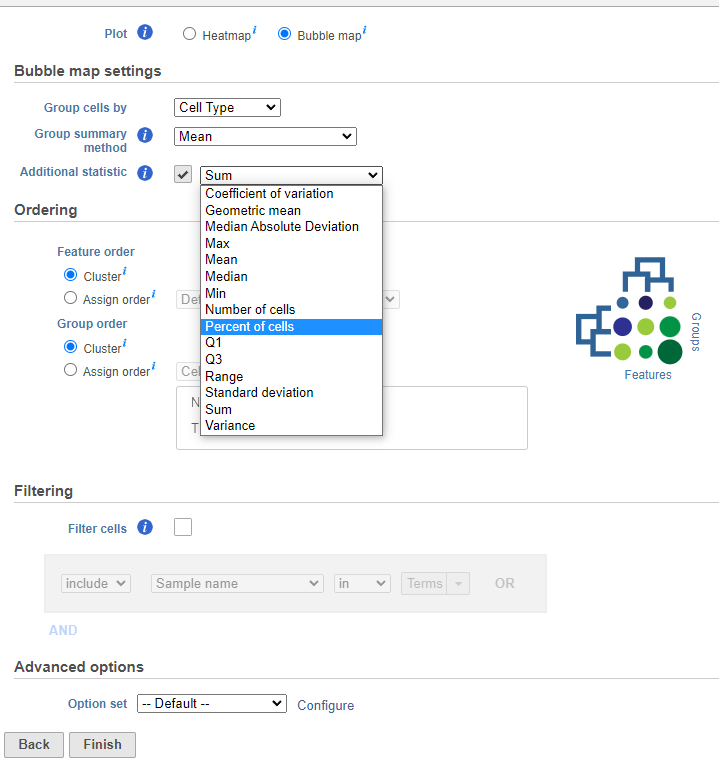 |
Configuration
There are plot Configuration/Action options for the Hierarchical clustering / heat map task which apply to both the heatmap and bubble map in the Data viewer (Figure 8): Data, Heatmap, Dendrograms, Annotations, Axes, Description, and Additional actions. Click on the icon/widget under Configure or use direct manipulation on the plot itself to open these options.
...
Overview
Content Tools